A drainage dashboard shows that water is rising.
The pumps are running. The sensors are online. The 3D model shows the location of every asset.
But the operations team still needs to answer a more difficult question:
Is the system responding as expected to the current rainfall, or is something restricting its capacity?
A visual model and live data can show where the water level is rising. A physics-based model can help the team explore how water should move through the network under particular conditions.
The difference matters when the next decision involves dispatching a crew, adjusting pump operations or warning a community.
From seeing an asset to understanding its behavior
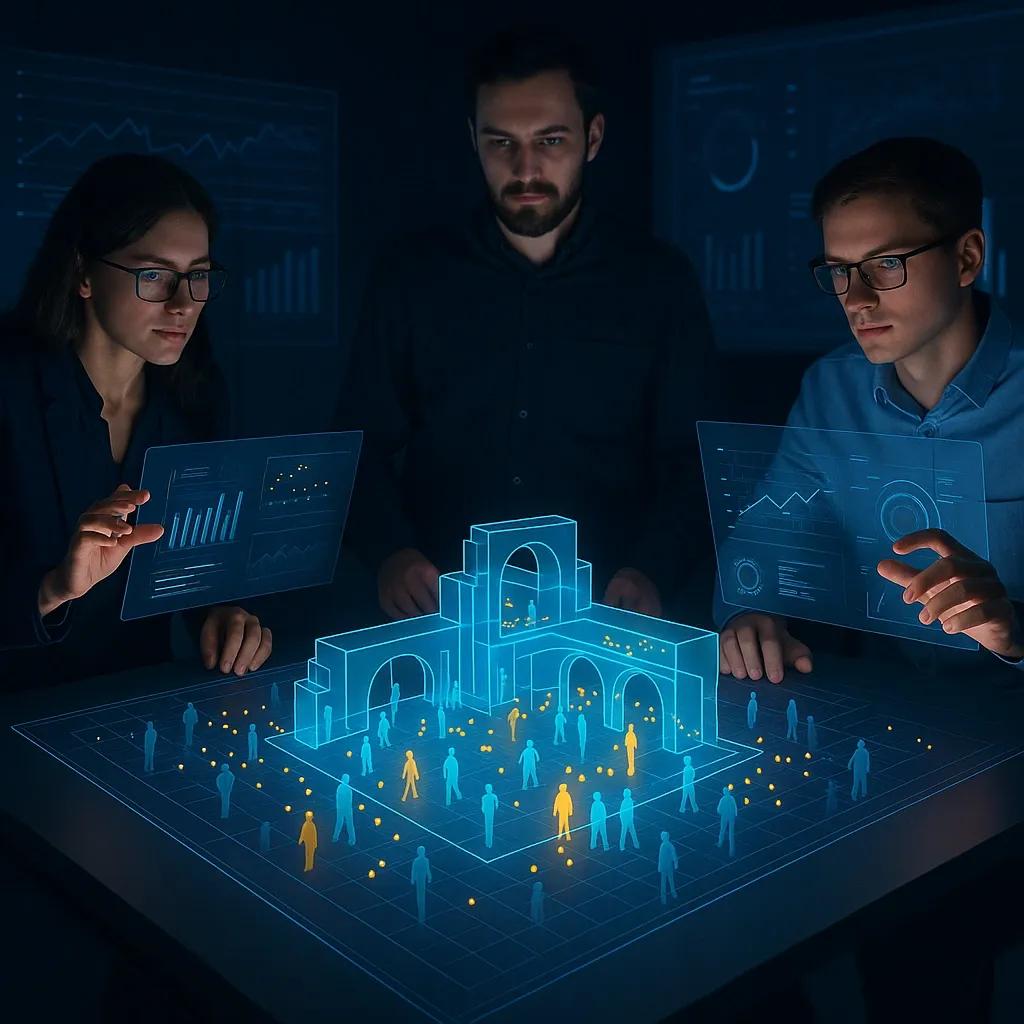
Many digital twin projects begin by bringing together three useful elements:
- A spatial or 3D representation of an asset.
- Sensor readings and operational data.
- A dashboard for monitoring current conditions.
That can be valuable. A utility operator who can locate a pump, view its maintenance history and see its current status already has a better starting point for action.
But a sensor reading alone does not explain the system around it.
A rising water level might reflect intense rainfall, a downstream restriction, pump underperformance, a tide affecting the outlet or a combination of these factors.
A physics-based model introduces relationships that help explain how a system is expected to behave. Depending on the use case, those relationships may describe water flow, heat transfer, structural forces, pressure, motion or energy conversion.
The value is not simply a more sophisticated model. It is the ability to compare observed behavior with expected behavior and investigate the difference.
What wave energy shows us
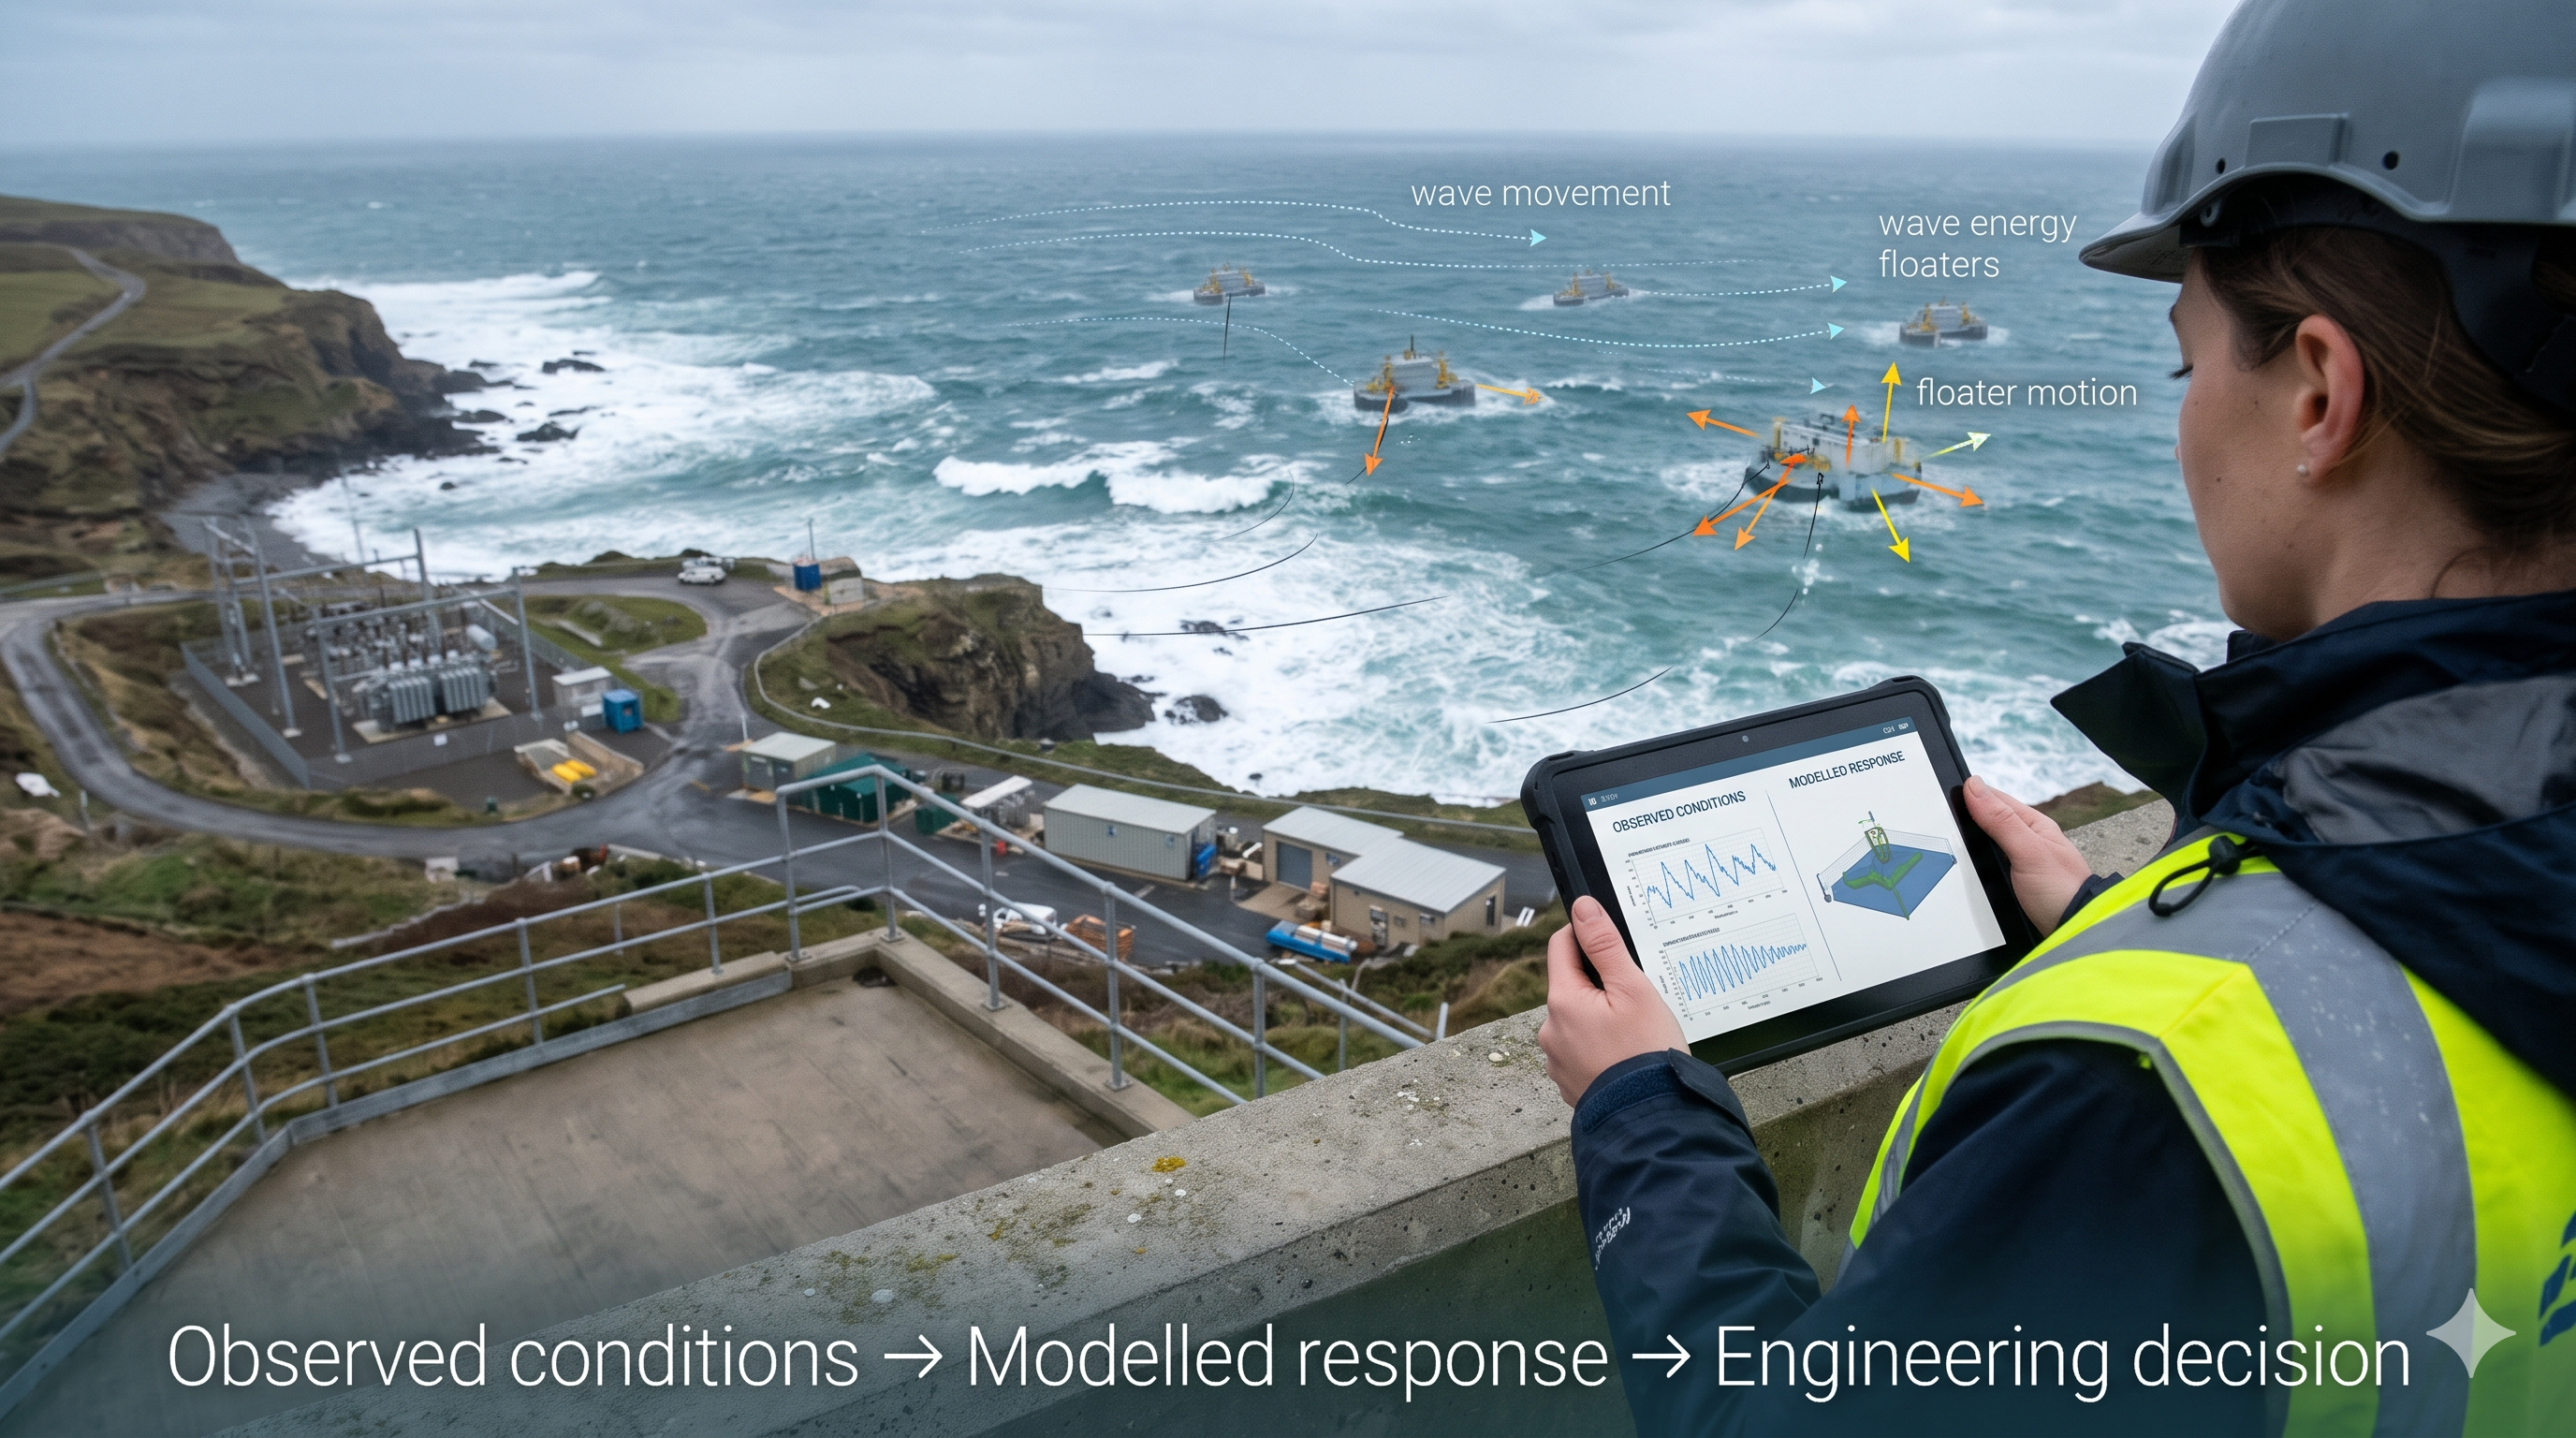
On 2 November 2026, Eco Wave Power announced that it had completed the first phase of an AI-powered digital twin programme with AI engineering GmbH.
According to the company, the work established a physics-based model of how ocean waves interact with its floating equipment. It included simulations of wave loading, floater movement, structural forces and potential energy generation under different sea conditions, alongside initial machine-learning capabilities for energy and load forecasting. Eco Wave Power
This is a useful example because the operational questions extend beyond equipment location or current sensor readings:
- How might different wave conditions affect movement?
- What mechanical loads could the equipment experience?
- How might those conditions influence potential energy production?
The announcement describes a first development phase. It does not, by itself, establish how accurately the model performs across every operating condition or how it will be used for operational decisions.
There is also an India connection. Eco Wave Power reported receiving a Bharat Petroleum purchase order for an initial site assessment related to a planned wave-energy pilot in Mumbai. That is a site-assessment step, not a commissioned installation. sec.gov
Physics gives data a context
Consider an illustrative drainage example.
A rainfall gauge records a heavy shower. Three water-level sensors report rising levels. A pump reports that it is operating.
Without a model of the system, the team can see the readings but may struggle to judge their significance.
A hydraulic model, using available information about the catchment, drainage geometry, pump capacity and downstream conditions, can estimate how the system might respond to that rainfall.
Suppose the observed level rises faster than the model expects. That difference could prompt an investigation. It might indicate an obstruction or a pump issue. It could also reflect an inaccurate rainfall input, incomplete drainage geometry, a sensor fault or an assumption that no longer holds.
The model has helped focus attention, but it has not proved the cause.
That distinction is where geospatial intelligence becomes useful. GIS can connect the affected catchment, drainage network, roads, properties and field observations. UAV imagery or site inspection can help investigate a suspected restriction. The engineering team can then assess the evidence and decide what action is appropriate.
The workflow becomes:
Observe → compare with expected behavior → investigate the difference → decide → verify the outcome.
A useful model also needs known limits
Adding physics does not automatically make a digital twin reliable.
The model may use outdated asset geometry. A parameter may be poorly estimated. Sensors may be inaccurate or stale. A simulation may have been tested under normal conditions but never against an extreme event.
Three questions should therefore accompany any model output:
- What is observed? Which measurements are available, when were they collected, and how reliable are they?
- What is estimated or predicted? Which results come from the model, what assumptions were used, and how uncertain are they?
- What decision can the result support? Is it sufficient to prioritize an inspection, recommend an operating change or support a higher-consequence engineering decision?
These questions matter because a model can be useful for one purpose without being sufficiently reliable for another.
A simplified hydraulic model may help prioritize locations for inspection. That does not automatically make it suitable for approving a major operating change.
NIST’s work on digital twin credibility highlights the need for verification, validation and uncertainty assessment across the lifecycle. The level of scrutiny should reflect the model’s influence on a decision and the consequences of being wrong. nist.gov
Start with a decision, then choose the model
Not every asset needs a high-fidelity simulation.
For a facility team trying to locate equipment and access maintenance records, an accurate spatial model may be enough. For an operator assessing how a system could respond to changing loads, a behavioral model may add significant value.
The practical starting point is a defined decision:
- What does the operator need to decide?
- What physical behavior affects that decision?
- What observations are available to test the model?
- What level of uncertainty is acceptable?
- Who reviews the result and authorizes action?
This approach also makes the commercial case easier to assess. A pilot can measure whether the model improves inspection prioritization, reduces response time, identifies performance deviations earlier or helps teams assess operating scenarios.
Those outcomes should be measured against an existing workflow. A visually impressive demonstration is not a substitute for evidence that a decision improved.
The geospatial layer connects the model to the real world
Physics-based models describe behavior, but they still depend on knowing which asset, which location and which conditions the model represents.
That is where the combination of GIS, BIM, reality capture and IoT becomes valuable.
GIS can provide the wider spatial context: terrain, catchments, coastlines, surrounding infrastructure and exposed communities. BIM and engineering records can describe asset configuration. Sensors provide observations over time. UAVs, satellites, LiDAR and field teams can reveal changes that may affect the model’s assumptions.
A specialist engineering model can then use relevant inputs to assess behavior, while the digital twin keeps the relationships between observations, model versions, outputs and decisions visible.
The responsibility for interpreting high-consequence engineering results remains with the appropriate qualified professionals.
A useful digital twin should help an organization understand not only what it is seeing, but also how the system may behave, where its assumptions are weak and what evidence is needed next.
The most important question is not how realistic the model looks. It is whether the model helps someone make a better decision and whether that improvement can be demonstrated.