Climate risk maps are becoming more detailed.
They can show urban heat islands, flood-prone neighborhoods, water stress, coastal exposure, vulnerable infrastructure and populations at risk.
But a technically accurate map does not automatically produce an investment decision.
A municipality may know which neighborhoods are hottest. A development bank may know which assets face flooding. An industrial estate may understand its future water exposure.
The difficult questions come next:
Where should limited capital be deployed first?
Which intervention will reduce the most risk?
Who should finance and implement it?
What evidence will prove that the investment worked?
This is where climate intelligence needs to move beyond hazard visibility and become investment intelligence.
The map is often where the real work begins
Most climate-risk workflows follow a familiar sequence:
Climate data → hazard model → exposure map → report
This creates awareness. It may support planning, disclosure or regulatory compliance. But it can leave the decision-maker with a portfolio of red zones and no defensible method for choosing what to fund.
Consider an urban heat-risk map.
It may identify several neighborhoods with high surface temperatures. Yet temperature alone does not determine investment priority. Decision-makers also need to understand:
- How many people are exposed?
- Which populations are most vulnerable?
- Which buildings and services are affected?
- What interventions are practical at each location?
- How much would each intervention cost?
- Who controls the relevant land or asset?
- What measurable benefit could be expected?
- How will results be verified after implementation?
Without this additional context, a hazard map may describe the problem while leaving the capital-allocation problem unresolved.
Earth observation is entering the investment workflow
An emerging example comes from work involving the European Space Agency and the European Bank for Reconstruction and Development in Novi Sad, Serbia.
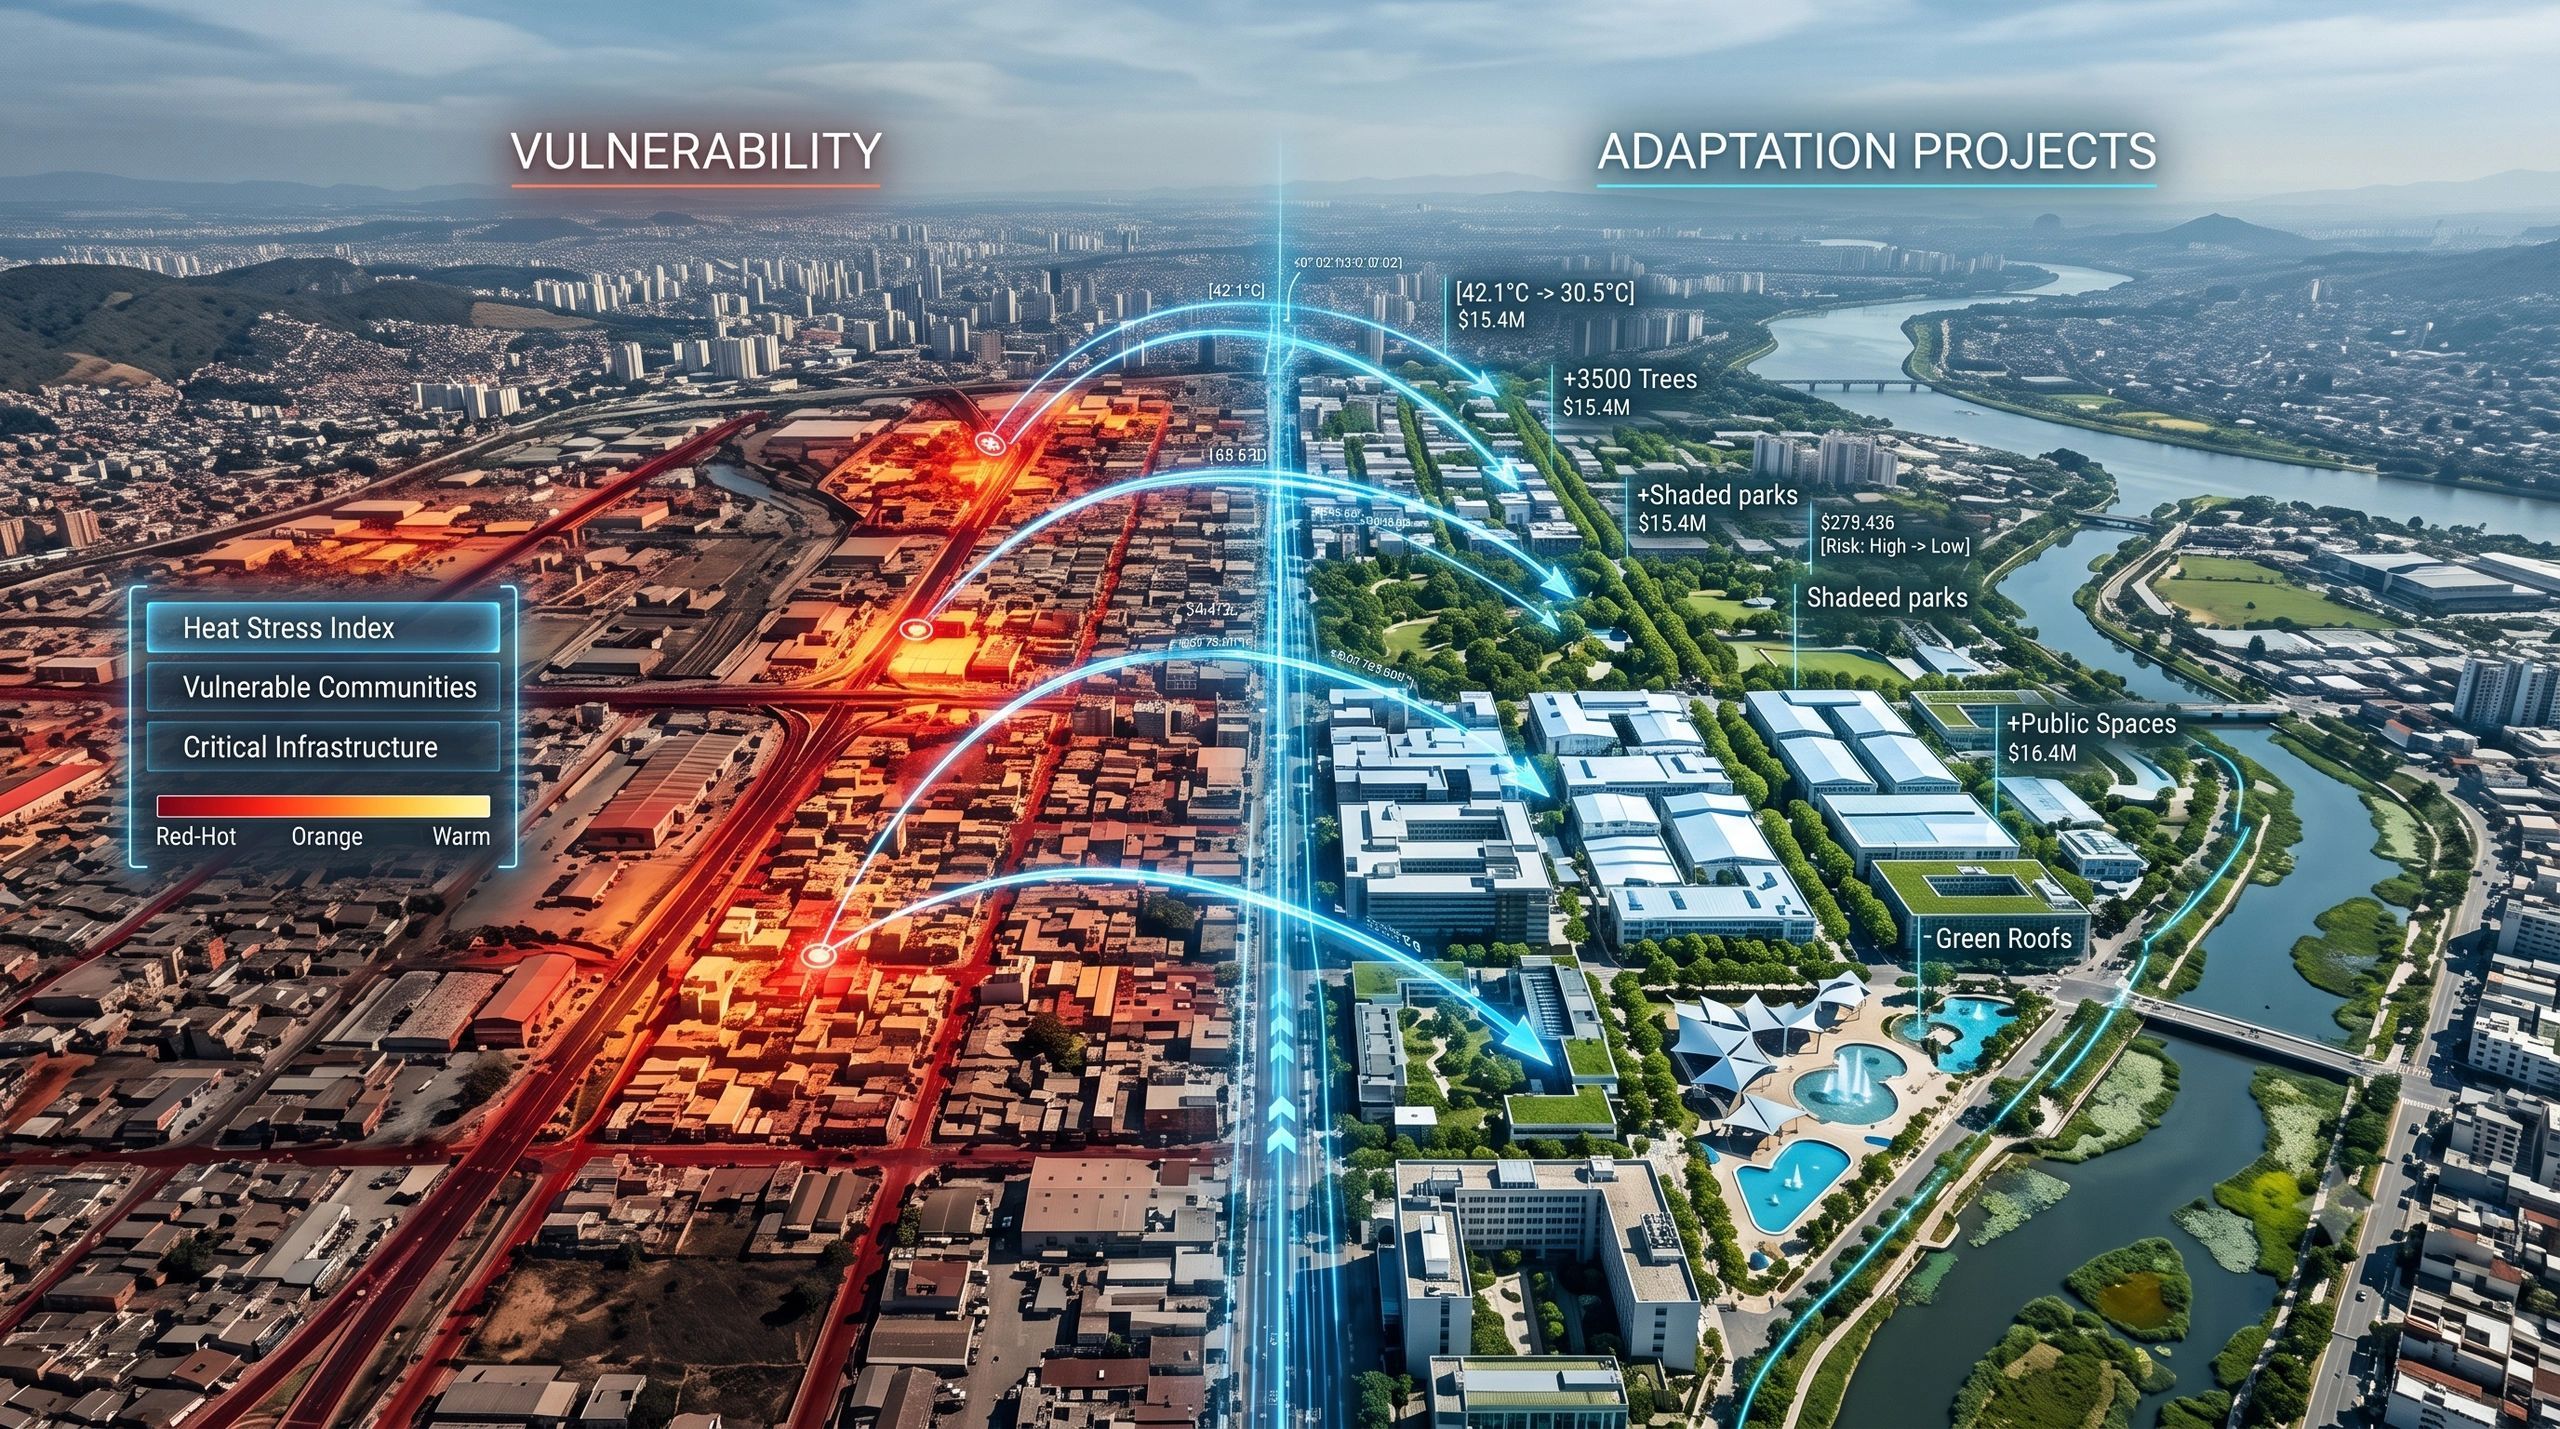
Satellite Earth observation is being used to identify urban heat hotspots, assess vulnerable populations and help target investible cooling interventions.
The important development is not simply better heat mapping. It is the connection between geospatial evidence and a potential financing decision.
The workflow starts to become:
Hazard → exposure → vulnerability → intervention → investment
This changes the value of Earth observation.
Satellite data is no longer used only to document environmental conditions. It becomes one input into deciding where cooling infrastructure, urban greening, shade systems, reflective surfaces or building-level improvements could produce the greatest benefit.
For investors and public agencies, this is a more useful proposition than another climate dashboard. It connects a spatially defined problem to a fundable response.
Risk severity is not the same as investment priority
The area facing the greatest climate hazard is not always the first area that should receive funding.
Investment priority depends on several factors:
1. Risk severity
How likely is the hazard, and how serious could its consequences be?
2. Exposure and vulnerability
Which people, assets, services and economic activities are affected—and how able are they to cope?
3. Intervention readiness
Is there a technically feasible project, an accountable owner, required approvals and a viable implementation path?
4. Expected benefit
How much physical, social or financial risk could the intervention reduce?
5. Evidence quality
Can the baseline, assumptions and eventual results be independently examined?
A location may have severe heat exposure but no implementation-ready intervention. Another may have a slightly lower hazard level but a clearly scoped project capable of protecting a hospital, transport interchange or dense residential population.
The second project may be more suitable for immediate funding.
The purpose of climate-investment intelligence is not to hide this judgement inside a composite score. It is to make the reasoning visible.
A Climate Adaptation Investment Twin
A practical next step is to connect climate analytics, asset information, intervention planning and financial evidence through what we might call a Climate Adaptation Investment Twin.
It would represent more than the physical environment. It would preserve the decision chain surrounding an adaptation investment:
Climate hazard → Exposed population or asset → Existing vulnerability → Proposed intervention → Estimated cost and benefit → Approval and funding status → Implementation progress → Post-intervention observation → Verified risk reduction
For example, an urban heat programme could connect:
- satellite-derived land-surface temperature;
- local weather and ground observations;
- population and public-health indicators;
- building and land-use data;
- proposed cooling or greening measures;
- ownership and implementation responsibility;
- estimated capital and maintenance costs;
- expected temperature or exposure reduction;
- observations collected after delivery.
This would allow decision-makers to ask more useful questions:
Which ₹10 crore of interventions should be funded first?
Which projects protect the highest number of vulnerable residents?
Which proposals are technically strong but blocked by land ownership or approvals?
Where is the evidence too weak to support investment?
Which completed measures have produced observable results?
These are investment and governance questions supported by geospatial intelligence.
From projected benefit to verified benefit
Climate-finance decisions rely heavily on models. Models are necessary because adaptation investments must often be approved before their future benefits can be observed.
But projected benefit should not be treated as verified benefit.
A credible workflow should distinguish between:
- Expected risk reduction based on modelling;
- Implemented intervention supported by delivery evidence; and
- Observed outcome supported by post-intervention monitoring.
Suppose a city funds a tree-canopy programme to reduce heat exposure. The evidence chain should not end when the trees are planted.
It should continue through survival rates, canopy development, changing surface temperatures, local environmental conditions and the effect on the population originally identified as vulnerable.
The verification period may extend across several seasons. Outcomes may also be influenced by weather variability, surrounding development and maintenance quality.
The twin should therefore preserve the baseline, model assumptions, intervention history and later observations. Otherwise, a visually convincing before-and-after comparison may suggest causation that the evidence cannot support.
Governance must remain visible
A high-priority location does not automatically create authority to act.
Every adaptation project sits within a governance setting involving land ownership, municipal responsibility, environmental permissions, procurement rules, community interests, operating budgets and maintenance obligations.
A decision-ready system should therefore show:
- who owns the affected asset or land;
- who is responsible for implementation;
- which approvals are required;
- what evidence supported prioritization;
- which assumptions remain uncertain;
- how funding conditions will be monitored; and
- who accepts and verifies the result.
This is especially important when development banks, insurers, infrastructure investors and public agencies work across the same programme. They may share the risk concern while using different financial, social and technical criteria.
The geospatial platform should not silently decide whose priorities prevail. It should make those priorities, trade-offs and responsibilities traceable.
The commercial value lies in the decision chain
The market opportunity is not limited to producing better climate maps.
Municipalities need capital-prioritization workflows. Development banks need investible project pipelines. Infrastructure investors need portfolio-level adaptation strategies. Insurers need evidence of risk mitigation. Industrial estates and property owners need to know which interventions protect business continuity.
This opens a broader role for GeoAI, Earth observation, IoT, BIM and digital twins.
Together, they can connect:
- regional hazards;
- individual assets;
- operational dependencies;
- vulnerable communities;
- proposed interventions;
- financial priorities; and
- evidence of outcomes.
The deliverable is no longer simply a heat map, flood model or climate-risk score. It is a traceable answer to a financial question.
Climate intelligence must help capital move
Climate-risk mapping remains essential. No sound investment decision can begin without understanding where the hazard exists.
But the next measure of value will be whether that intelligence helps capital move toward specific, feasible and measurable interventions.
The strongest climate platforms will not merely show where risk is increasing. They will help decision-makers determine what should be funded, why it should be prioritised, who must act and what evidence will demonstrate that the investment reduced risk.
A climate map explains where the problem is.
A climate-investment workflow helps society decide what to do about it.