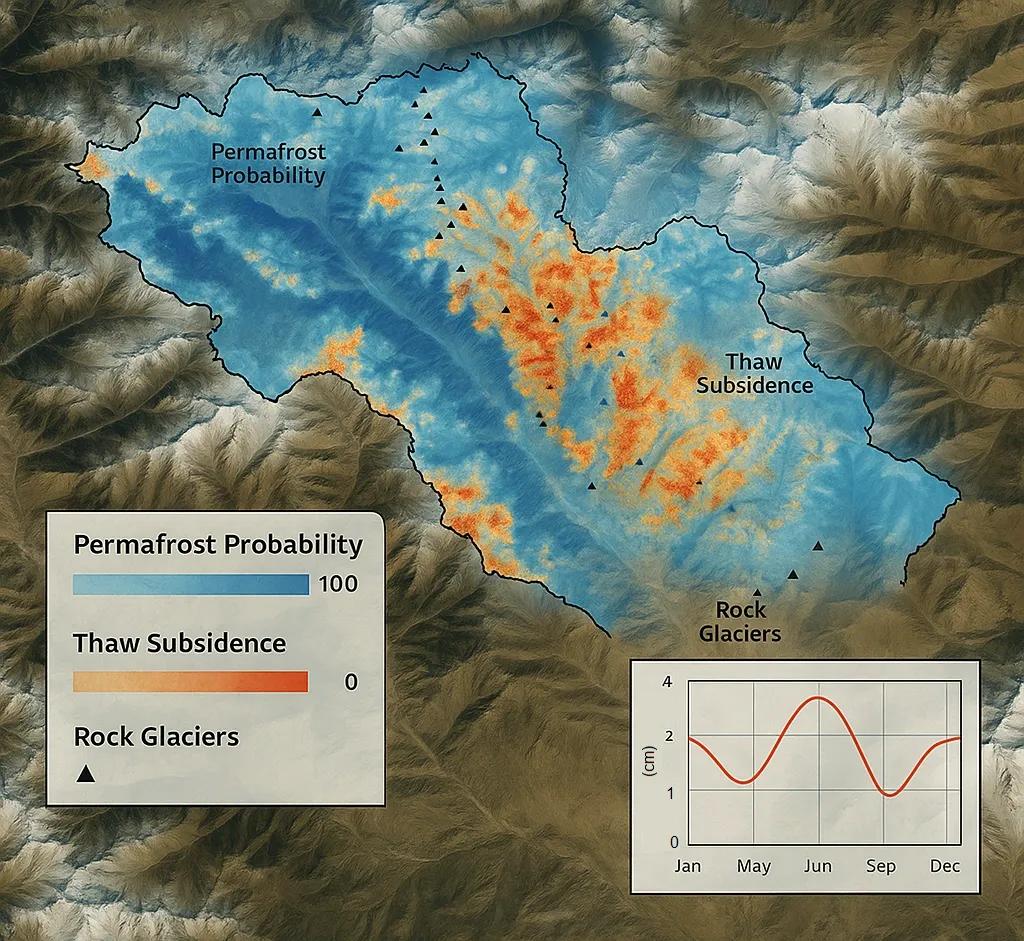
The Frozen Ground Beneath Our Feet Is Starting to Move
Permafrost, ground that remains frozen for at least two straight years, behaves like Earth’s natural cement.
When it thaws, the landscape doesn’t simply warm; it deforms .
Roads buckle, buildings tilt, slopes fail, and buried ice collapses into sudden sinkholes.
In high-mountain Asia, including parts of Ladakh, Lahaul–Spiti, Uttarakhand, and Arunachal , permafrost isn’t as continuous as the Arctic, but the patches that exist are critical stability anchors for steep terrain.
As warming accelerates, these frozen patches are transitioning from structural support to risk surfaces .
Permafrost is now a geospatial layer, one that must be mapped, monitored, and integrated into infrastructure planning.
What Makes Permafrost a Risk Layer?
Permafrost failure occurs when buried ice melts, causing thaw subsidence , vertical lowering of the ground.
Mechanisms include:
Melting ice lenses → ground collapse
Loss of soil strength → infrastructure instability
Slope failures → landslides and rockfalls
Increased groundwater flow → erosion
New thermokarst lakes → terrain reorganization
In India’s high-altitude roads and military infrastructure, these risks are already visible as:
Cracked pavements
Tilted retaining walls
Deformed culverts
Seasonal ground heave and slump
Understanding where permafrost is and how it changes requires geospatial thermal intelligence .
Mapping Permafrost: From Thermal Texture to Modelled Layers
Himalayan permafrost cannot be surveyed purely on ground, the terrain is remote, steep, and often inaccessible.
Instead, we rely on multi-sensor geospatial proxies to infer its presence and probability.
1️⃣ Land Surface Temperature (LST)
Derived from MODIS, Landsat, and ECOSTRESS
Cold-season minimums identify probable frozen ground
Multi-year trends detect warming hotspots
2️⃣ Surface & Terrain Indicators
Elevation ( > 4,000–4,500 m typically)
North-facing slopes
Shadow duration (hillshade)
Slope curvature
Rock glacier signatures
3️⃣ Rock Glacier Inventories
Rock glaciers are permafrost proxies , slow-moving, lobate bodies of debris + ice.
Sentinel-2 + Google Earth basemaps now allow:
Mapping of active rock glacier fronts
Detecting movement using InSAR
4️⃣ InSAR Subsidence Detection
Interferometric SAR (Sentinel-1, TerraSAR-X, ALOS-2):
Tracks vertical ground motion to millimeter precision
Identifies seasonal heave (freeze) and slump (thaw)
Detects early warning signals for slope failures
Subsidence rates of 1–3 cm/yr have been reported in Tibetan Plateau rock glacier regions, similar processes exist in India’s higher elevations.
Thaw Subsidence: Detecting Terrain Collapse from Space
Subsidence is the clearest indicator of permafrost degradation.
It appears as:
Negative LOS (line-of-sight) displacement in InSAR
Increased soil moisture in Sentinel-1 backscatter
Surface depression in high-resolution DEMs (PlanetScope stereo, LiDAR, ICESat-2 ATL03)
Typical signatures:
Smooth lowering across plateau-like permafrost
Localized pits and troughs
Accelerated deformation near infrastructure
Melt-out zones around rock glaciers
These observations allow creation of Permafrost Hazard Maps aligned with real-world deformation.
Himalayan Permafrost Zones: Emerging Patterns
Using a combination of remote sensing + modelled permafrost probability layers (similar to the ESA Permafrost CCI):
Ladakh: Highest permafrost probability (up to 70–80%) above 4,800 m
Lahaul–Spiti: Active rock glaciers dominate, major thaw subsidence zones
Uttarakhand: Discontinuous pockets near 5,200–6,000 m
Arunachal Pradesh: High precipitation → warm and unstable permafrost patches
In many of these areas, infrastructure expansion intersects thawing ground , amplifying long-term risk.
Using GeoAI to Predict Permafrost Thaw
AI models are now improving the accuracy of permafrost prediction.
Random Forest / XGBoost: Combine LST, DEM, slope, aspect, albedo
CNNs: Detect rock glacier landforms automatically
LSTM: Model thermal ground response to climate variables
SAR time-series ML: Predict thaw subsidence from displacement trends
These models produce probability surfaces that can be integrated directly into engineering and risk assessments.
Toward a Permafrost Digital Twin
A permafrost digital twin would continually ingest:
Thermal time-series (LST, air temperature)
InSAR deformation maps
Snow cover duration
Ground ice probability
Rock glacier movement fields
Climate projections
This twin could simulate:
Future thaw hotspots
Subsidence risk along roads, tunnels, pipelines
Structural stress on foundations
Changing slope stability patterns
Critical for:
Border infrastructure
High-altitude habitations
Hydropower and transmission lines
Disaster management in Himalayan states
Conclusion
Permafrost is no longer just a cryospheric variable, it is a risk layer for mountain infrastructure, stability, and water systems.
By integrating SAR subsidence, ICESat-2 elevation change, thermal anomalies, and modelled ground-ice probability, we can now map where the ground is literally beginning to move.
In a warming Himalaya, permafrost maps must become engineering inputs, not academic outputs.