
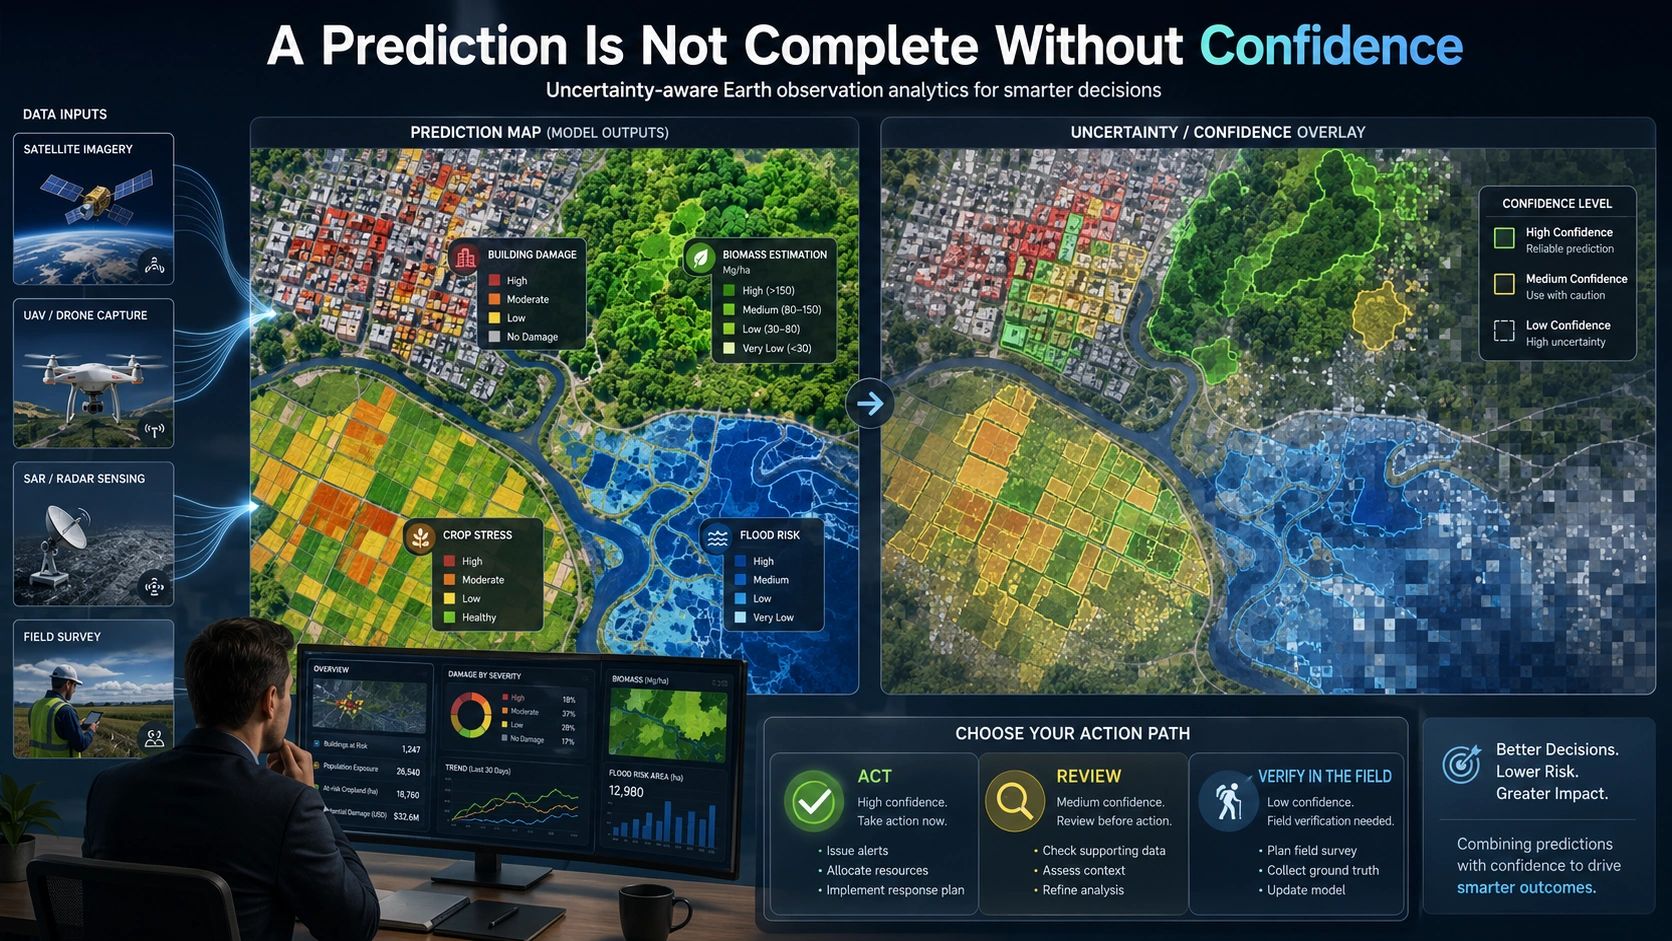
Earth observation analytics should never present a prediction as a fact.
A biomass estimate may show 85 tonnes per hectare.
A building-damage model may classify a structure as severely affected.
A crop-monitoring system may identify water stress.
A flood model may outline the expected inundation zone.
But unless the result also communicates confidence, the decision-maker cannot know whether to act immediately, request field verification or treat the output as an early warning.
This is becoming one of the most important trust issues in operational geospatial intelligence.
Precision Is Not the Same as Certainty
Modern EO systems can generate highly detailed maps from satellite imagery, SAR, thermal data, LiDAR, UAV imagery and time-series observations.
The outputs often look precise.
They contain sharp boundaries, numerical values, colour-coded risk classes and asset-level predictions. This visual precision can create the impression that the result is equally certain everywhere.
It rarely is.
A model may perform well in areas that resemble its training data and poorly in regions with different building materials, vegetation types, terrain, weather conditions or seasonal patterns.
Cloud cover may reduce optical-image quality.
Radar effects may create distortions around tall buildings or steep terrain.
Field reference data may be sparse or outdated.
A biomass model developed for one forest type may not transfer reliably to another.
The prediction may still be useful. But its limitations must travel with it.
The Hidden Risk in a Single Number
Consider a carbon project where an EO model estimates above-ground biomass.
A map showing “100 tonnes per hectare” appears straightforward. But that number could represent several very different situations:
The estimate may be strongly supported by multiple observations and recent field measurements.
It may be based on incomplete seasonal imagery.
It may fall outside the conditions represented in the model’s training data.
It may carry a wide range of possible values.
These situations should not be treated equally in carbon accounting, project financing or verification.
The same principle applies to building height estimation, disaster-damage assessment, crop-yield prediction, shoreline change, land-use classification and infrastructure monitoring.
Without uncertainty, users receive an answer.
With uncertainty, they receive information about how much they should trust that answer.
What a Decision-Ready EO Output Should Contain
A prediction layer alone is not enough.
A decision-ready EO product should combine five elements:
Prediction: What does the model estimate?
Confidence: How reliable is the estimate at this location?
Provenance: Which imagery, dates, sensors and models produced it?
Decision threshold: At what confidence level can action be taken?
Verification route: Where is field inspection or additional data required?
This creates a simple operational formula:
- Decision-ready EO = Prediction + Confidence + Provenance + Action Rule
For example, instead of showing only a building-damage category, the system could communicate:
“High probability of major damage, based on post-event SAR and optical imagery, with 87% model confidence. Priority field verification recommended within 24 hours.”
That output is far more useful to an emergency-response team than a red polygon with no explanation.
Uncertainty Should Be Spatial
A single accuracy score for an entire model is also insufficient.
EO conditions vary from place to place.
One part of a city may have clear imagery and reliable building footprints. Another may contain shadows, informal structures, dense vegetation or outdated reference data.
A national-scale forest model may perform well in frequently sampled regions and carry much higher uncertainty in remote areas.
Confidence should therefore be represented spatially.
A useful interface might show the primary prediction layer together with a confidence surface. Users could filter results by confidence, highlight low-certainty zones and prioritise those areas for field surveys, UAV capture or higher-resolution imagery.
This turns uncertainty into an operational planning layer.
It answers a practical question:
Where should we spend the next unit of verification effort?
Where Confidence Changes the Decision
In carbon MRV, uncertainty affects the credibility of biomass estimates, baselines and claimed emission reductions. Projects may need conservative accounting where confidence is low.
In disaster response, uncertainty can help agencies distinguish between areas suitable for immediate resource deployment and areas needing rapid field confirmation.
In urban planning, building-height or density estimates may support early analysis, but low-confidence areas should not automatically influence zoning, infrastructure investment or compliance action.
In agriculture, uncertain crop-stress predictions may trigger additional scouting rather than an immediate intervention across the entire farm.
In asset monitoring, change detection should distinguish between a likely physical change and a possible sensor, seasonal or registration effect.
The purpose is not to delay decisions until perfect information becomes available.
The purpose is to match the decision to the quality of the evidence.
Uncertainty Is Not a Sign of a Weak Model
Many solution providers hesitate to expose uncertainty because they fear it will reduce user confidence.
In practice, hiding uncertainty creates the greater risk.
A platform that reports limitations clearly is often more trustworthy than one that presents every result with the same level of authority.
In my 27 years of working with geospatial data, I have repeatedly seen organisations focus heavily on making maps look convincing while giving far less attention to explaining where the underlying information is incomplete.
The visual layer becomes polished.
The assumptions remain hidden.
This becomes especially dangerous when AI-generated outputs are connected directly to financial, regulatory, infrastructure or public-safety decisions.
Confidence should not be treated as a disclaimer placed at the end of a report. It should be part of the product architecture.
From Analytics Platform to Decision System
EO platforms are now moving beyond map generation toward operational decision support.
That transition requires more than faster models or higher-resolution data.
It requires systems that understand when they know, when they are uncertain and when additional evidence is needed.
A mature workflow could automatically route high-confidence results to operational teams, send medium-confidence cases for analyst review and assign low-confidence areas for field verification or new data acquisition.
Over time, those verified observations can return to the model, improving future predictions.
This creates a continuous loop:
Observe → Predict → Quantify confidence → Verify → Decide → Learn
That is the foundation of a trusted spatial-intelligence system.
Confidence Must Become a Standard Deliverable
Clients should begin asking different questions when procuring EO analytics.
Not only:
“How accurate is the model?”
But also:
“Is the confidence calibrated?”
“Can uncertainty be mapped at pixel, object or asset level?”
“What happens when the model encounters unfamiliar conditions?”
“Can users trace a prediction back to its source observations?”
“How does uncertainty influence the recommended action?”
EO analytics is becoming powerful enough to influence major decisions in climate finance, urban resilience, agriculture, insurance, utilities and infrastructure.
That makes uncertainty quantification essential.
The next generation of geospatial platforms should not merely tell us what is likely happening.
They should also tell us how confident they are; and what we should do when that confidence is low.