The Patterns That Move Everything
Winds are not just invisible motion, they’re data in motion.
Every gust, current, and jet stream follows physical laws that can now be modeled, visualized, and optimized.
In geospatial science, winds are treated as vector fields , directional datasets that power everything from aviation planning to renewable energy siting and disaster logistics.
When mapped over time, these fields reveal how the planet redistributes energy, and how we can use that intelligence to move goods, people, and power more efficiently.
Reading the Planet’s Vectors: The Science of Wind Fields
A wind field is a spatially continuous dataset describing both speed (magnitude) and direction (angle) at any given point.
Each grid cell holds two values, the u (east-west) and v (north-south) components of velocity.
Together, they form a vector layer , often visualized as arrows that flow across maps.
Modern geospatial systems ingest wind data from reanalysis datasets , combining satellite, radar, and model outputs:
ERA5 (ECMWF Reanalysis): Global 0.25° resolution, hourly data for 1950–present.
NCEP/NCAR Reanalysis: 2.5° resolution, multi-decadal coverage.
MERRA-2 (NASA): Integrates satellite radiance for better upper-atmosphere accuracy.
These datasets are the climate memory of the planet, the baseline against which we predict wind-driven change.
Turning Vectors into Decisions
Wind field data becomes actionable when translated into sector-specific geospatial layers:
Sector - Application - Key Metrics
Renewable Energy - Wind farm siting - Mean speed, turbulence, direction frequency
Aviation & Shipping - Route optimization - Jet stream velocity, headwinds/tailwinds
Disaster Management - Cyclone tracking - Surface & 850 hPa vector convergence
Agriculture - Pollination and evapotranspiration modeling - Seasonal wind direction and intensity
Urban Planning - Air quality dispersion - Surface wind patterns and ventilation corridors
Every arrow on a wind map is a potential decision, where to build, how to route, when to act.
India’s Wind Vector Story
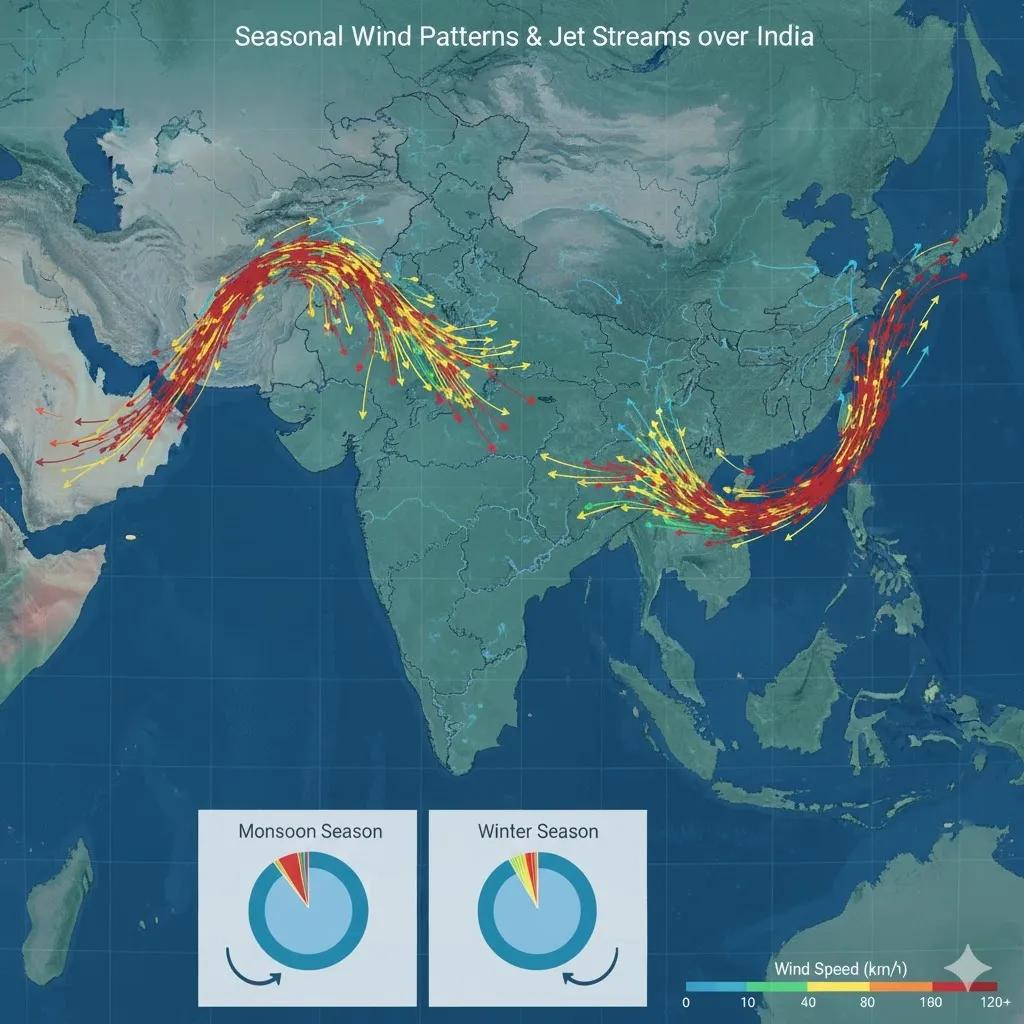
India’s geography creates contrasting wind regimes , from the southwest monsoon inflows to the northeast retreating winds.
This diversity powers both its energy strategy and climate resilience planning.
Key Reanalysis Insights (ERA5, 2000–2023):
Southwest Monsoon Jet (SWJ): Dominates June–September, mean surface speed ~7–9 m/s across the Arabian Sea.
Northeast Monsoon Winds: Reverse flow patterns along Tamil Nadu coast, critical for rainfall forecasting.
Western Disturbances: Upper-level westerlies influence North India’s winter rainfall.
Wind Energy Corridors: Tamil Nadu, Gujarat, and Karnataka maintain >6 m/s annual mean at 100 m hub height.
These vector datasets are now foundational in India’s National Wind Atlas and renewable zoning maps.
Winds in Motion: From Reanalysis to Real Time
Reanalysis gives the historical baseline, but modern operations need live vector intelligence.
This is where numerical weather prediction (NWP) and IoT-linked models bridge the gap:
WRF (Weather Research and Forecasting Model): Generates high-resolution local wind fields (1–3 km).
SCADA + LiDAR Integration: Validates model data with on-ground turbine readings.
GIS Dashboards: Convert model grids into actionable logistics maps for ports, airports, and wind farms.
The result is a digital twin of atmospheric movement , updated hourly, informing decisions on flight routes, ship paths, and renewable dispatch planning.
Use Case 1: Wind-Aware Logistics Corridors
In 2024, India’s National Logistics Policy (NLP) began integrating reanalysis wind data into route optimization:
Coastal shipping models account for monsoon headwinds and wave direction.
Drone delivery corridors (DGCA’s BVLOS initiatives) use near-surface wind fields for safety thresholds.
Air cargo hubs overlay wind climatology with runway alignment to reduce crosswind fuel loss.
By treating wind data as a spatial variable , logistics networks become safer and more efficient.
Use Case 2: Wind Energy Digital Twin
At the Muppandal Wind Farm (Tamil Nadu) , one of Asia’s largest, ERA5 reanalysis data is fused with IoT turbine sensors:
Wind rose analysis shows seasonal direction variability of ±12°.
Real-time data calibrates CFD (Computational Fluid Dynamics) models of wake losses.
AI algorithms predict hourly energy yield based on incoming vector trends.
This integration improved energy forecasting accuracy by 15% , enabling better grid balancing.
GeoAI + Vector Analytics
Wind data is inherently spatio-temporal, perfect for machine learning:
LSTM (Long Short-Term Memory) networks predict short-term wind anomalies.
Graph Neural Networks (GNNs) map interconnections between vector nodes (e.g., jet stream linkages).
Clustering Algorithms identify persistent circulation patterns (e.g., Arabian Sea gyres).
Such AI-driven vector analytics allow dynamic rerouting of air and maritime traffic before conditions deteriorate, turning atmospheric complexity into predictive control.
Visualization: The Beauty of Vector Fields
From a visualization perspective, wind maps are among the most expressive forms of geospatial data.
Each arrow encodes direction, magnitude, and energy, like musical notes across the planet.
Tools like Earth.nullschool.net , Windy , and Cesium-based 3D wind twins make it possible to visualize global air motion in real time, layered with temperature, humidity, and pressure, a living portrait of the planet’s atmosphere.
Outlook: Winds as Infrastructure
If we treat wind not as weather but as infrastructure , the implications are profound:
Air routes optimized for energy efficiency.
Ships navigating “green corridors” with wind-assist propulsion.
Smart cities oriented for ventilation and air quality.
Wind power integrated seamlessly into hybrid renewable grids.
The next evolution is clear, a Wind Digital Twin for India , linking reanalysis, IoT, and predictive logistics.
Conclusion
Winds may be invisible, but they are measurable, mappable, and monetizable.
By decoding vector fields from reanalysis to real-time models, India can transform atmospheric motion into strategic mobility intelligence , guiding how we move goods, generate energy, and adapt to a changing climate.
Because every gust tells a story, if we know how to read its vectors.