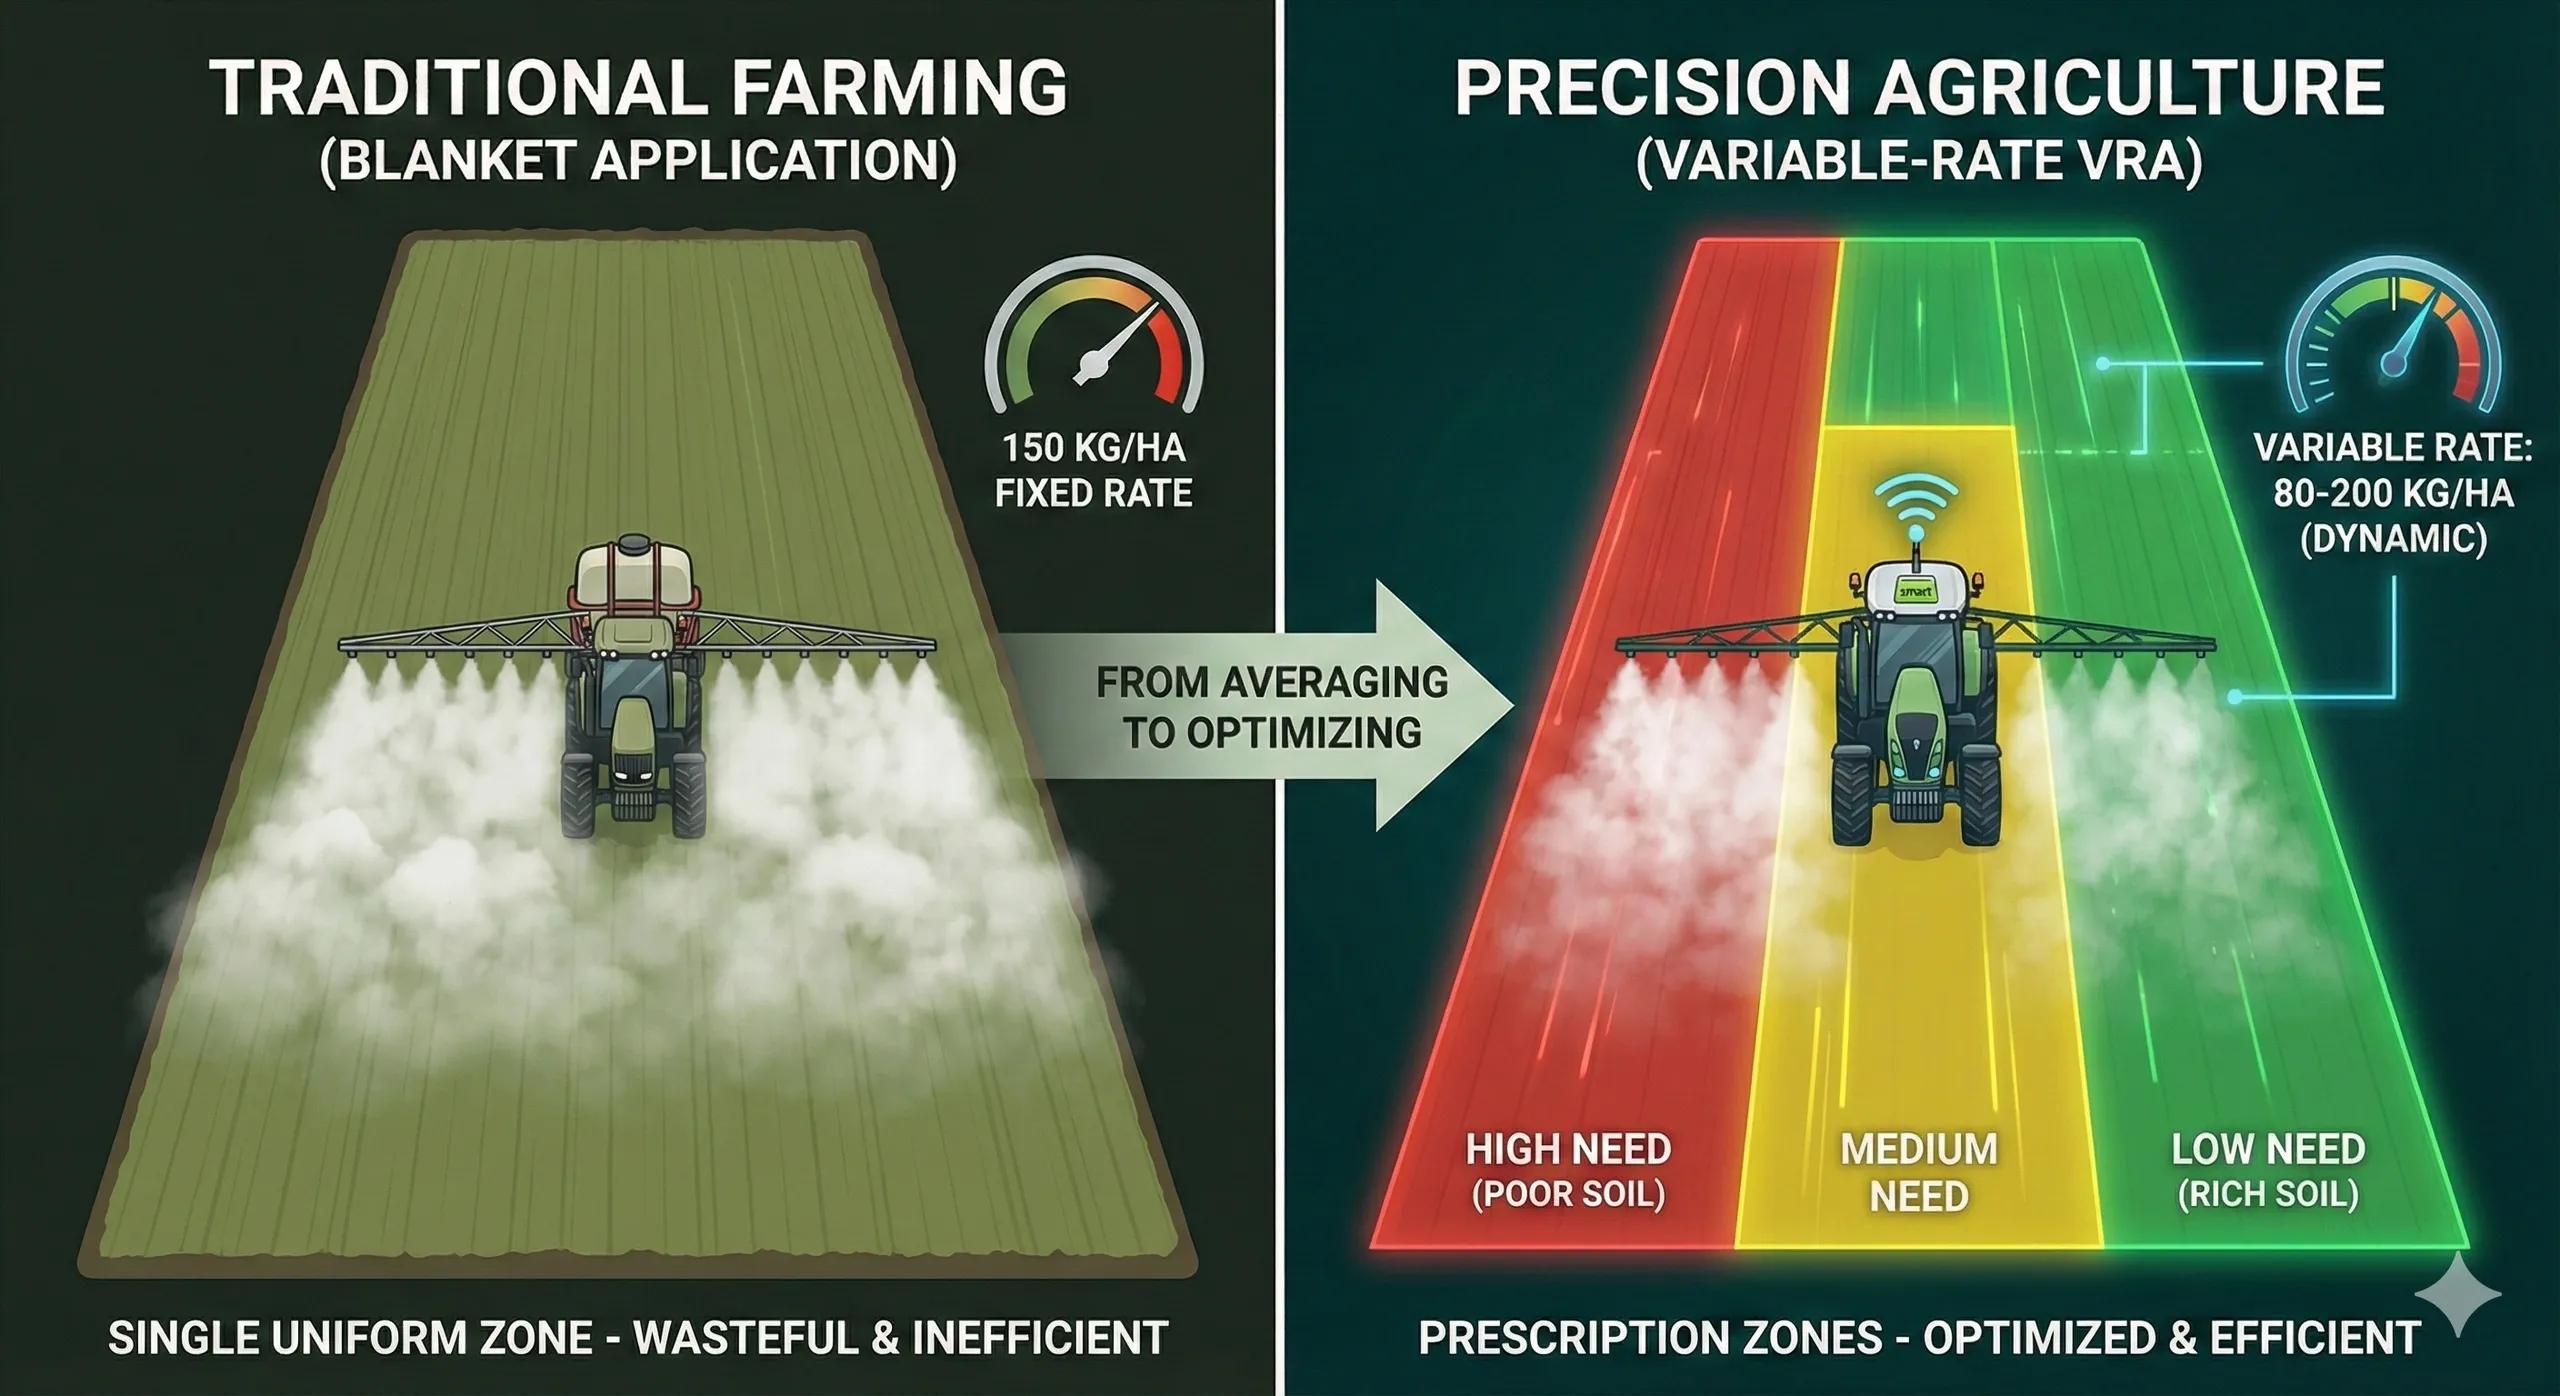
What if every part of a field could receive exactly what it needs, no more, no less?
Agriculture has always treated fields as uniform blocks.
But fields are heterogeneous systems , soil moisture varies by patch, SOC changes meter by meter, slope alters runoff, and crop vigor shifts across seasons.
Variable-Rate Technology (VRT) changes this by using zoning and prescription maps to tailor inputs, seeds, fertilizers, irrigation, chemicals, spatially across a field.
Instead of managing land by boundaries, we manage it by zones .
1️⃣ The Logic Behind Variable-Rate Inputs
Every field contains micro-variability driven by:
soil texture + SOC
moisture & infiltration
slope + aspect
nutrient residuals
historic crop performance
compaction zones
waterlogging patches
Treating these micro-zones uniformly causes:
wasteful fertilizer use
yield variability
over-irrigation
nutrient loss
lower profitability
Zoning + VRT solves this by making inputs data-driven and site-specific .
2️⃣ Zoning: Turning Fields Into Management Units
Zoning is the process of converting raw spatial variability into Management Zones (MZs) .
Typical input datasets:
A. Vegetation Indices (NDVI/EVI/NDRE)
Time-series reveals consistent high/medium/low productivity patches.
B. Soil Maps
texture
SOC
pH
EC
micronutrients
C. Moisture Maps (SAR)
Shows irrigation distribution & stress zones.
D. Terrain Models (DEM-derived)
depressions → waterlogging
ridges → dry stress
slope → erosion risk
E. Yield Maps (from harvesters)
The gold-standard layer where available.
Using clustering methods like k-means, fuzzy c-means, ISODATA , fields are divided into 2–6 zones , each representing a unique productivity profile.
Zones become the decision layer for variable-rate agriculture.
3️⃣ Prescription Maps: The Digital Instructions for Machinery
Once zones are defined, prescription maps specify:
A. Variable-Rate Fertilizer
Higher doses in low-SOC or high-demand zones, lower doses where crop vigor is already high.
B. Variable-Rate Seeding
higher seeding in high-SOC, well-drained areas
reduced seeding in stress zones
C. Variable-Rate Irrigation
Using soil moisture + ET + slope behavior.
D. Variable Spraying
Targeted chemical/weedicides for specific zones.
Prescription maps are exported as:
shapefiles
GeoTIFFs
machine-specific formats (John Deere, Trimble, CNH)
These maps tell the machinery exactly how much to apply at each geospatial coordinate .
4️⃣ Multi-Season Analytics: The True Power of Time-Series
One season is not enough to understand field variability.
True zones emerge from multi-season patterns :
consistent low-vigor zones → soil degradation
consistently high stress → drainage problem
inconsistent performance → weather-driven behavior
This is why VRT workflows fuse:
3–5 years of NDVI time-series
SAR moisture variability
DEM-derived terrain
soil sampling grids
Stable zones produce the most reliable prescription maps .
5️⃣ GeoAI for VRT Optimization
AI enhances zoning and prescriptions:
A. Cluster Validation Models
Assess whether the zones are biologically meaningful.
B. Yield Prediction Models
Estimate zone-wise yield response to fertilizer.
C. Prescription Optimization Algorithms
Minimize cost while maximizing expected yield.
D. Zonal Variability Forecasting
Predict how zones shift under different rainfall or irrigation scenarios.
E. Decision Support Engines
Generate zone-specific recommendations automatically:
NPK blend
micronutrient requirement
irrigation hours
seeding density
expected ROI
GeoAI turns VRT from “advanced agronomy” into routine farm intelligence .
6️⃣ India: Why Variable-Rate Inputs Are Critical
India’s agricultural landscape is defined by:
soil diversity within small plots
uneven irrigation
monsoon variability
input cost pressures
fragmented holdings
government push for precision farming
VRT can reduce:
fertilizer costs by 10–25%
water use by 20–40%
yield losses by 5–15%
carbon emissions (N₂O)
groundwater depletion
Programs like PMKSY, Soil Health Cards, and carbon markets align well with VRT-based approaches.
7️⃣ Future: Farm-Level Digital Twins
A Field Digital Twin integrates:
soil texture + SOC
moisture (SAR)
crop vigor
ET demand
weather
irrigation logs
prescription history
yield outcomes
This allows continuous improvement: “Zones → Prescriptions → Results → Updated Zones → Smarter Prescriptions.”
VRT becomes a closed-loop system , not a one-time intervention.
Conclusion
Variable-Rate Inputs convert fields from uniform plots into dynamic management zones .
Zoning reveals the internal variability; prescription maps translate it into targeted action and precision agriculture.
Together, they make agriculture more efficient, profitable, and climate-smart.
A field that is managed zone-wise performs better, because it responds to its own internal logic.