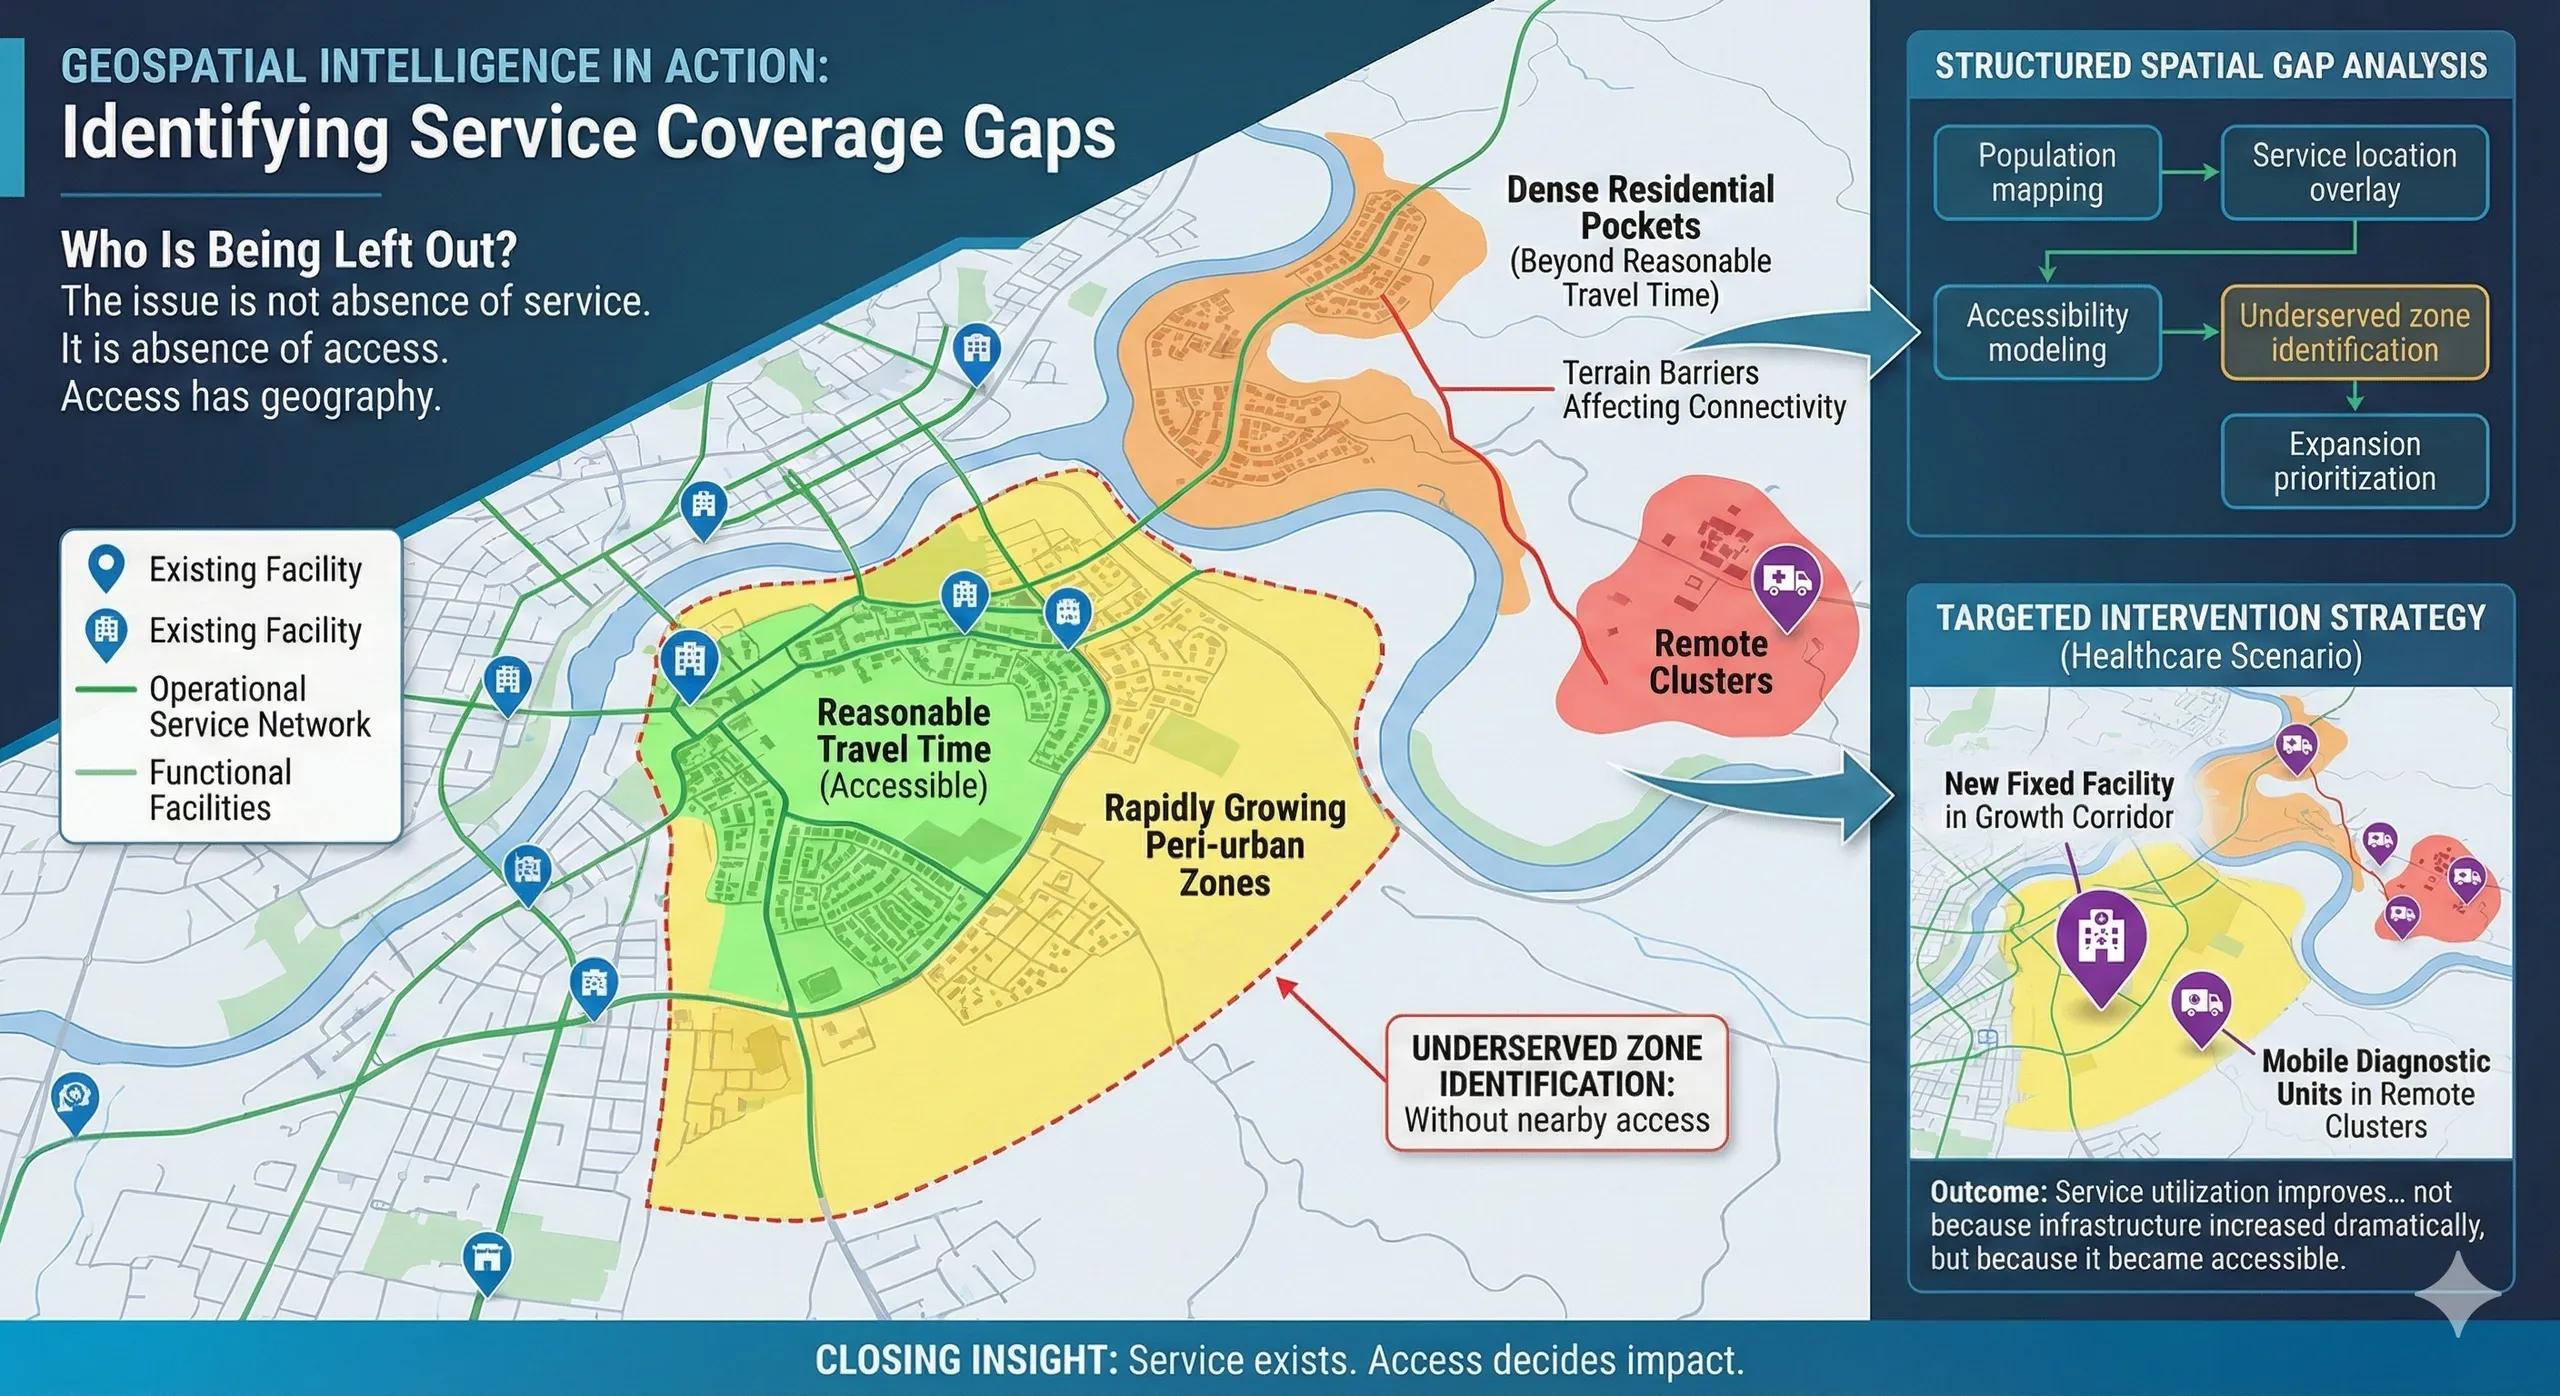
Infrastructure may exist.
Services may be operational.
Facilities may be functional.
Yet large sections of a population often remain underserved.
The issue is not absence of service.
It is absence of access.
Access has geography.
The real decision behind service coverage or delivery
Governments, utilities, healthcare providers, financial institutions, and telecom operators constantly face this question:
Are we truly reaching the people who need our services?
Most service expansion decisions rely on:
Aggregate population numbers
Administrative boundaries
Existing facility distribution
Historical usage patterns
But these indicators do not always reveal spatial inequity.
Service gaps often exist at the micro-level, within neighborhoods, peri-urban edges, and remote clusters.
Why location intelligence reveals hidden inequities
Geospatial intelligence enables organizations to analyze:
Population density vs facility proximity
Travel time and connectivity
Terrain barriers
Socioeconomic distribution
Network capacity constraints
By mapping service reach against real-world accessibility, decision-makers can see where infrastructure exists, but accessibility does not.
Instead of asking:
“Do we have enough facilities?”
The more accurate question becomes:
“Who cannot realistically access them?”
That distinction changes planning priorities.
From data to decision: the coverage gap flow
A structured spatial gap analysis often follows:
Population mapping → service location overlay → accessibility modeling → underserved zone identification → expansion prioritization
This transforms service planning from administrative allocation to spatial equity planning.
The outcome is not just a map, it is a targeted intervention strategy.
A practical scenario
Consider a regional healthcare authority reviewing its diagnostic centers.
On paper, facility distribution appears adequate. However, spatial analysis shows:
Dense residential pockets beyond reasonable travel time
River and terrain barriers affecting connectivity
Rapidly growing peri-urban zones without nearby access
The authority decides to deploy:
A new fixed facility in a growth corridor
Mobile diagnostic units in remote clusters
Service utilization improves, not because infrastructure increased dramatically, but because it became accessible.
Business and operational impact
When organizations apply spatial coverage gap analysis, they typically achieve:
Higher service utilization rates
Improved public satisfaction
Better resource targeting
Reduced inequality perception
More defensible expansion decisions
For private enterprises, it also translates into tapping underserved markets.
Where service planning often falls short
Common limitations include:
Planning based on district averages
Ignoring travel-time realities
Overlooking rapid urban expansion
Treating facilities as static rather than demand-responsive
Without spatial analysis, coverage appears adequate, until dissatisfaction or inefficiency emerges.
Scaling coverage intelligence into systems
Forward-looking organizations build ongoing spatial monitoring frameworks that continuously track:
Population shifts
Urban expansion
Usage intensity
Service performance
This connects naturally with digital twins and operational dashboards, turning service planning into a dynamic decision system.
The monetization bridge
As service portfolios expand across regions, manual assessments become inconsistent. Organizations increasingly look for structured advisory approaches and scalable spatial decision platforms that standardize how coverage gaps are identified and prioritized, ensuring service equity aligns with operational efficiency.
Looking ahead
With mobility data, AI-driven accessibility modeling, and real-time demand signals, coverage gap analysis will move from static planning to continuous monitoring.
The goal will no longer be just service presence.
It will be measurable accessibility.
Closing insight
Service exists.
Access decides impact.
The difference lies in understanding where gaps truly remain.