The Hidden Heat Maps of Our Cities
Cities aren’t just warmer, they’re structured to be warmer.
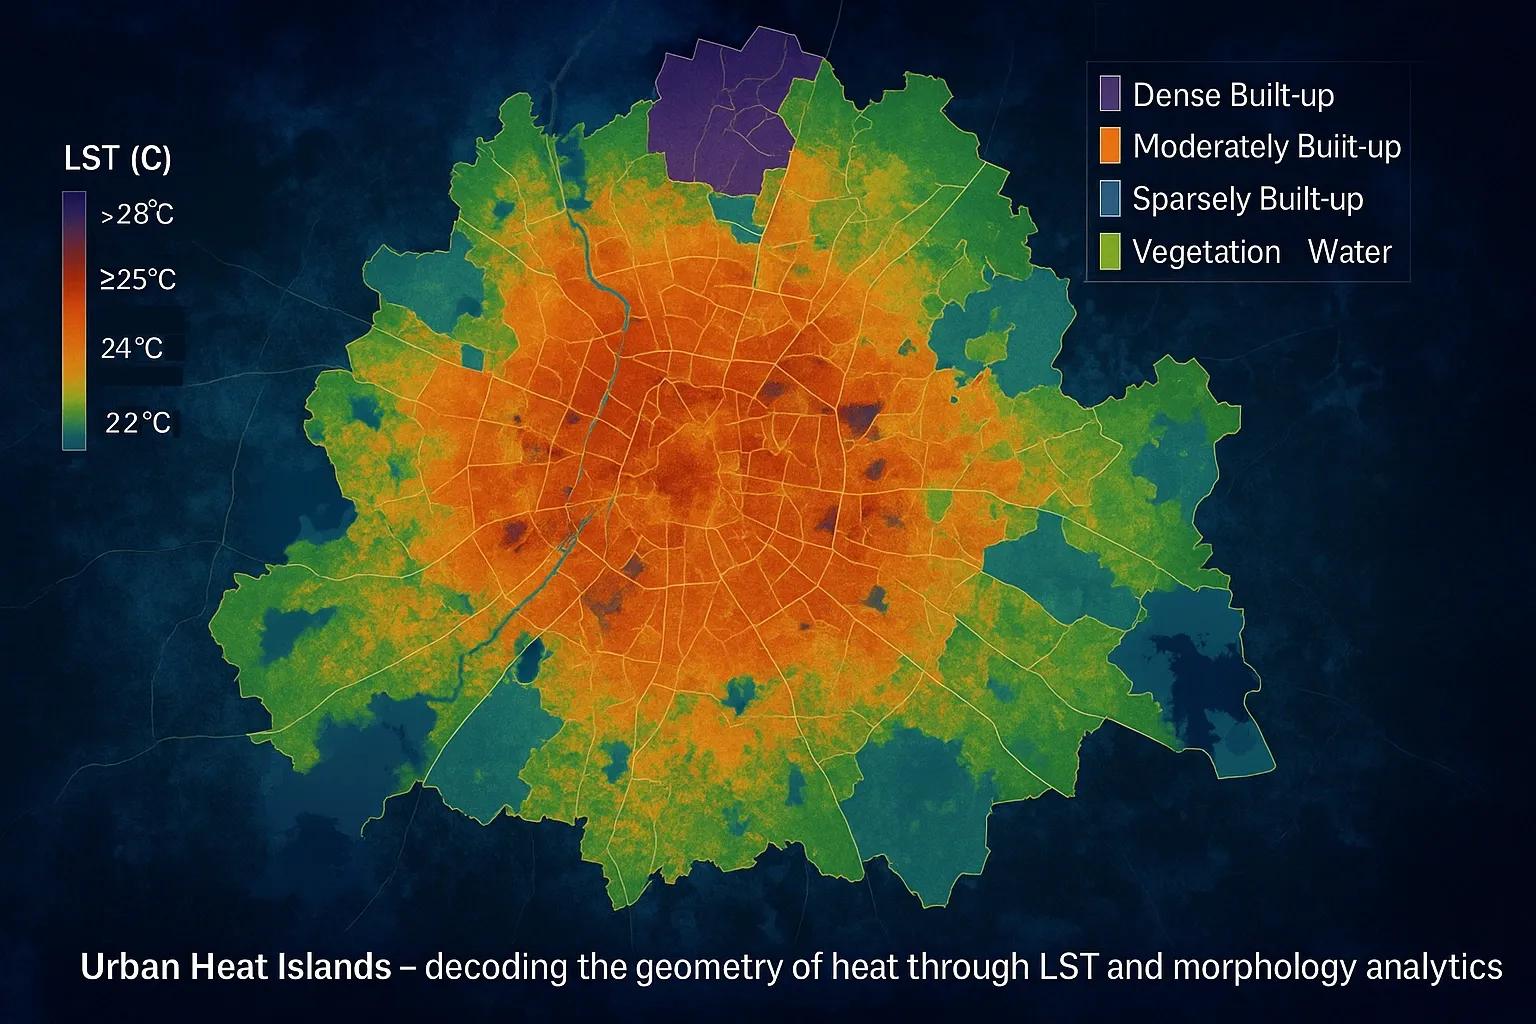
Glass, concrete, asphalt, and traffic collectively trap and re-radiate heat, creating what scientists call Urban Heat Islands (UHIs) , zones where air and surface temperatures can exceed surrounding rural areas by 3°C–8°C .
But now, with Land Surface Temperature (LST) data , morphological metrics , and geospatial analytics , we can map, measure, and even mitigate this phenomenon at street scale.
Urban heat is no longer anecdotal, it’s a quantifiable spatial signature.
What the Satellite Sees: Mapping Urban Heat
Every city emits its thermal fingerprint.
Satellites like Landsat 8/9 TIRS , MODIS , and ECOSTRESS record the Earth’s emitted infrared radiation, which can be converted into LST , the temperature of the surface “skin” of the planet.
Typical workflow for LST-based UHI detection:
1️⃣ Acquire LST data:
Landsat 8/9 TIRS → 100 m resolution.
MODIS Terra/Aqua → 1 km daily composites.
Sentinel-3 SLSTR → 500 m thermal product.
2️⃣ Derive UHI intensity (ΔT):
UHI = T (Urban) - T (Rural)
Compare core city pixels with peripheral greenbelt or rural reference zones.
3️⃣ Enhance interpretation using morphology metrics:
NDVI (vegetation cover).
NDBI (built-up density).
Albedo (reflectivity).
Sky View Factor (SVF) and building height/density from LiDAR or DSMs.
The fusion of these datasets allows analysts to decode why specific neighborhoods trap heat, not just where .
India’s Urban Heat Mosaic
Across India’s megacities, UHI signatures are visible in every satellite overpass.
Key insights from recent LST analyses (2020–2024):
Delhi NCR: Peak nighttime UHI intensity up to 6.5°C in dense industrial belts.
Hyderabad: Urban expansion between 2000–2020 increased mean LST by 3.1°C .
Mumbai: Coastal wind moderation keeps daytime LST lower, but built-up cores trap heat after sunset.
Ahmedabad: Compact morphology amplifies UHI, accentuated during pre-monsoon months.
In all cases, urban form , not just population, determined heat distribution.
Decoding Urban Morphology: The “Shape of Heat”
Geospatial urban morphology metrics reveal the physical form that drives heat accumulation.
Indicator - Data Source - Influence on Heat
Building Density (FAR) - GIS cadastral data, DSMs - Higher density → lower air ventilation
Surface Albedo - Sentinel-2 reflectance - Low albedo (dark surfaces) absorb more heat
Green Fraction (NDVI) - Sentinel-2, Landsat - Vegetation lowers LST through evapotranspiration
Impervious Surface Index - NDBI - High imperviousness → higher LST
Sky View Factor (SVF) - LiDAR/DSM - Low SVF traps radiative heat at night
These parameters can be modeled spatially in a GIS to produce Urban Thermal Vulnerability Maps , essential for city planners and climate action plans.
Case Example: Hyderabad Urban Heat Study
A 2023 analysis combining Landsat 9 LST , Sentinel-2 NDVI/NDBI , and DSM-derived building height revealed:
Mean LST: 36.2°C (urban) vs. 30.8°C (rural fringe).
Maximum UHI intensity: +5.4°C in dense central zones.
Negative correlation (r = -0.72) between NDVI and LST, confirming vegetation’s cooling role.
Compact urban cores showed the lowest Sky View Factor (0.25–0.35) , indicating limited heat escape.
Such datasets are now feeding into Hyderabad’s Climate Action and Resilience Plan (CARP) for heat mitigation.
Morphology Meets Management
Once identified, UHIs can be mitigated through geo-informed design :
Green Infrastructure: Urban tree belts and reflective rooftops lower LST by 2–3°C.
Water Bodies: Artificial lakes and blue corridors cool adjacent zones.
Urban Form Optimization: Building orientation and open-space ratios improve air circulation.
High-Albedo Surfaces: Reflective pavements reduce surface absorption by up to 40%.
By linking thermal analytics with spatial planning layers, cities can prioritize heat-sensitive zones for intervention.
GeoAI for UHI Forecasting
AI-driven geospatial models now predict heat stress before it peaks:
Random Forest and CNNs: Classify high-risk thermal zones using LST, NDVI, NDBI inputs.
LSTM Models: Predict diurnal temperature variation from multi-year Landsat archives.
Hybrid Digital Twins: Integrate IoT sensors (temperature, humidity) with satellite-driven thermal maps for real-time updates.
In effect, GeoAI turns UHIs from a static satellite snapshot into a living, adaptive heat twin of the city.
Outlook: Toward Climate-Responsive Urban Twins
The next frontier in urban planning is Climate Digital Twins , integrating LST, morphology, and socio-economic data to simulate microclimate interventions.
A twin could test:
How planting 1,000 street trees alters local LST.
Whether green roofs outperform cool pavements in energy efficiency.
How building heights modify urban ventilation corridors.
Such simulation-ready datasets will help Indian cities design climate-positive master plans , where resilience isn’t an afterthought but a design input.
Conclusion
Urban heat islands aren’t just environmental anomalies, they’re spatial consequences of design.
By combining LST data with urban morphology, we can finally quantify the geometry of heat, and engineer cities that breathe again.
Heat, once an invisible byproduct of growth, is now a geospatial metric for sustainability.