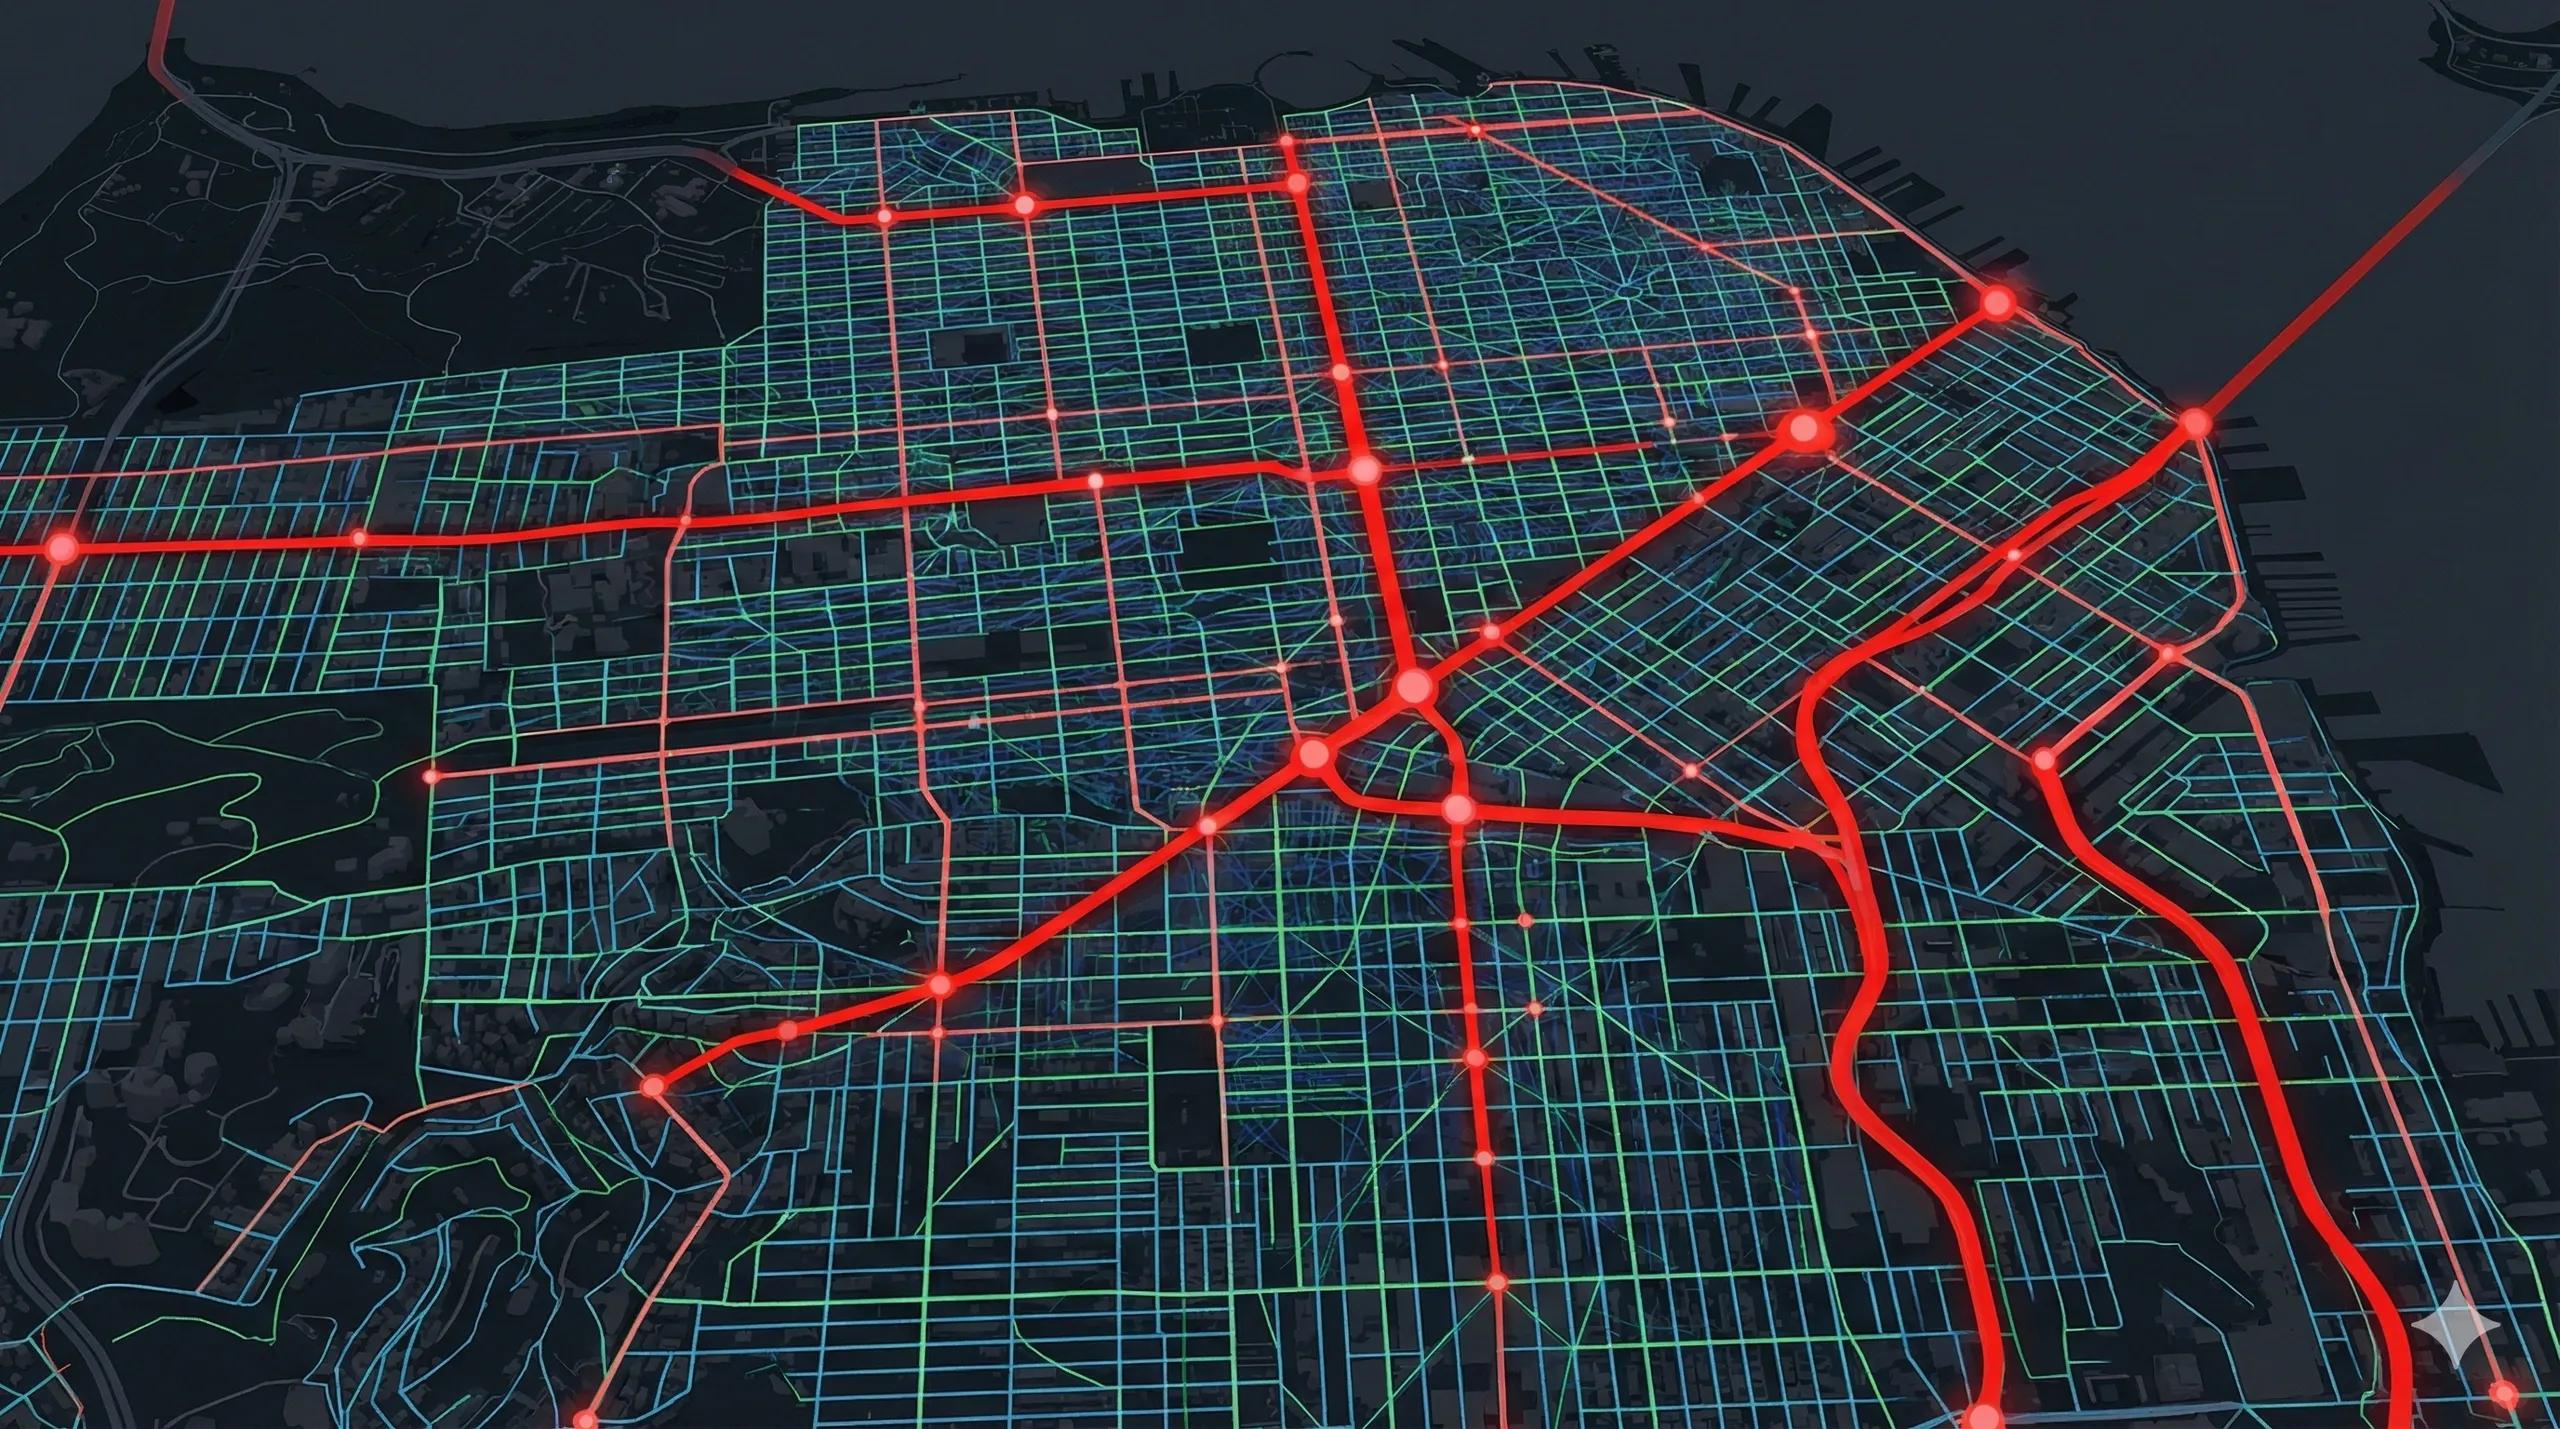
What if cities could be understood the same way we analyze river networks or tectonic lineaments?
Urban form looks chaotic at first glance, a maze of roads, intersections, blocks, and shortcuts. But beneath this complexity lies a graph :
a connected network of nodes and edges through which people, vehicles, goods, and information flow.
Cities, when converted into graphs, reveal patterns that satellite images and masterplans cannot show.
This is the science of urban centrality , network flow , and urban graph analytics , the hidden geometry of how cities move.
Why Convert Cities into Graphs?
Because cities function as flow systems , not geometric layouts. Graph theory helps quantify:
Movement efficiency
Congestion hotspots
Accessibility
Resilience (how easily a city breaks when links fail)
Walkability & last-mile connectivity
Transit network design
Emergency routing
Land value gradients
It’s the closest we get to decoding the logic of the urban fabric.
1️⃣ Nodes, Edges, and the Anatomy of an Urban Graph
When a city is converted into a graph:
Nodes = intersections, junctions, metro stations, bus stops
Edges = roads, streets, footpaths, bridges, transit lines
Once the network is built (usually from OpenStreetMap, municipal GIS, or road vector layers), urban metrics start to emerge.
2️⃣ Centrality: The Heartbeat of Urban Flow
Centrality measures how important a road or intersection is in the larger network.
Degree Centrality
How many roads meet at a junction.
High-degree = roundabouts, major intersections.
Betweenness Centrality
How often a road lies on the shortest path between two points.
High-betweenness = roads carrying hidden loads even if they look narrow.
This metric alone predicts:
Congestion hotspots
Logistical bottlenecks
High-value commercial corridors
Closeness Centrality
How quickly you can reach any part of the city from a location.
High-closeness areas become mobility hubs.
Eigenvector Centrality
Influence of a node based on connected influential nodes.
This is how CBDs emerge naturally , even without zoning.
3️⃣ Flow: The Physics of the Urban Graph
Cities behave like fluid networks :
People = particles
Roads = conduits
Congestion = friction
Transit = forced flow
Intersections = valves
Using graph analytics, urban planners map:
Traffic directionality
Pedestrian desire lines
Goods movement patterns
Public transport efficiency
Emergency access routes
Combining centrality + flow gives a complete mobility picture .
4️⃣ Topology vs Geometry: Why Cities Break Differently
A road network may look dense geometrically, but topologically it may be fragile.
For example:
A city can have 10,000 km of roads but only 3–5 critical edges keeping the network connected.
If those edges fail, the city fractures into isolated islands.
This is how floods, construction, and accidents paralyze cities.
Urban graph analysis reveals:
Bridges as high-criticality edges
Flyovers as topological shortcuts
Metro corridors as backbone edges
Bypasses as network “pressure release valves”
5️⃣ India: Big Urban Patterns Revealed Through Graphs
Graph analysis across Indian cities shows interesting contrasts:
Delhi
Grid + radial network → multiple redundancy paths
High closeness centrality → efficient reachability
Mumbai
Linear, constrained by geography → extremely high betweenness
Few bridges act as stress points → fragile topology
Bengaluru
Organic growth → high betweenness pockets → chronic congestion
Peripheral ring roads act as bypass stabilizers
Hyderabad
Ring–radial structure → efficient flow
Old city shows fractal-like organic graphs → walkable but slow for vehicles
GIS + graph theory takes the subjective experience of traffic and turns it into measurable patterns.
6️⃣ GeoAI for Urban Graph Operations
AI models can enhance graph insights with:
GNNs (Graph Neural Networks) for traffic forecasting
LSTM for signal optimization
Cluster detection for walkability zones
Agent-based simulations on graph layers
Optimization engines for emergency routing
This makes urban twins more intelligent.
7️⃣ Urban Digital Twins Powered by Graph Logic
Urban digital twins incorporate:
Centrality heatmaps
Real-time traffic sensors
Metro & bus movement data
Pedestrian density
Land use layers
Risk layers (flood, AQI, heat islands)
Cities become operational systems , not just built environments.
Conclusion
The urban fabric is not just roads and concrete, it is a living network .
Graph theory reveals how people truly move, how cities breathe, and where they choke.
Incorporating graph-based analytics into urban planning leads to more efficient, equitable, and resilient cities.
Urban networks are not designed; they evolve.
Graph theory simply shows us the pattern nature followed in building them.