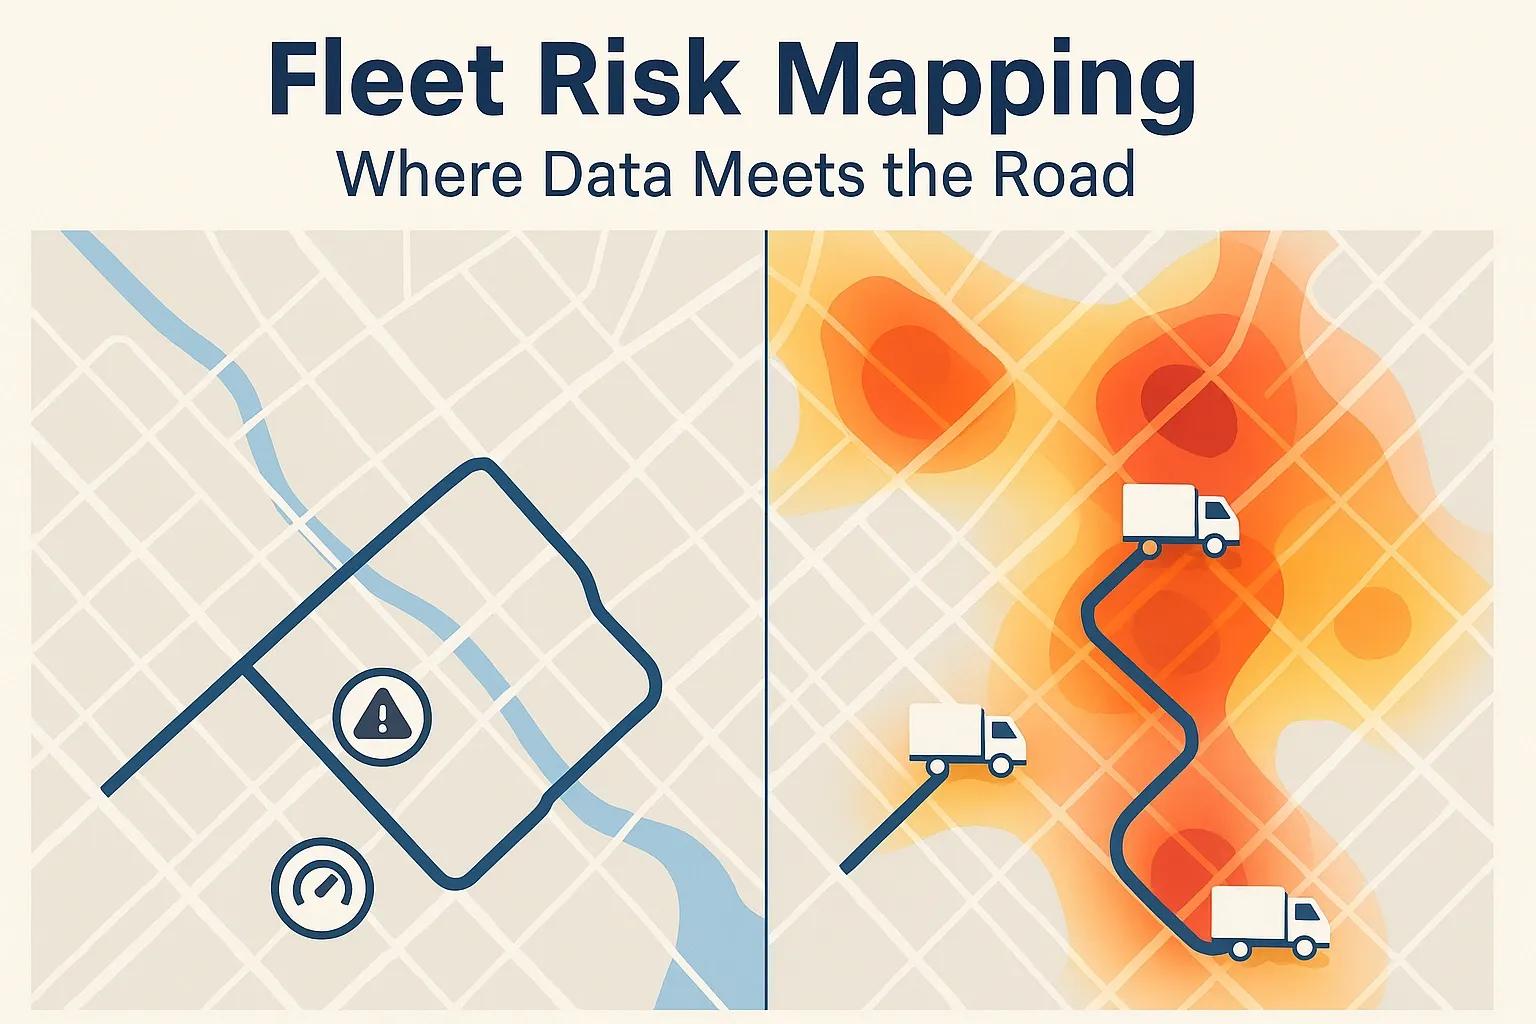
In today’s data-driven logistics ecosystem, the convergence of telematics and Geographic Information Systems (GIS) is shaping a new approach to fleet risk management. One of the most promising outcomes of this integration is Fleet Risk Mapping, a method that leverages telematics data and geospatial analytics to identify high-risk zones, analyze spatial patterns of incidents, and optimize routes to reduce both operational risks and insurance premiums.
This article explores how telematics and GIS work together to generate spatial incident heatmaps, how they can be used by fleet managers and insurers, and how this integration contributes to cost-effective and safer logistics operations.
1. Understanding the Building Blocks
What is Telematics?
Telematics refers to the integration of telecommunications and informatics, primarily used in the transportation sector to monitor vehicle movements, driving behavior, and vehicle diagnostics. Data collected via telematics include:
GPS location
Speed
Harsh braking or acceleration
Idling time
Engine performance
Incident events (e.g., collisions, sudden stops)
This data is captured in real time using onboard diagnostic devices and is transmitted to a central system for analysis.
What is GIS?
GIS is a system that captures, stores, analyzes, and visualizes geographic data. It enables users to interpret spatial patterns and relationships in data by layering multiple datasets on a map. In fleet management, GIS is used to:
Plan routes
Analyze traffic patterns
Monitor location-based hazards
Map environmental and social variables affecting logistics
2. What is Fleet Risk Mapping?
Fleet Risk Mapping is the process of identifying geographic zones that pose elevated risks to fleet vehicles by combining telematics and GIS datasets. The result is a spatial incident heatmap that highlights areas with high concentrations of accidents, vehicle damage, theft, or violations.
These heatmaps are visual tools that help stakeholders understand not only where risks are occurring, but also why . Insights drawn from this process allow logistics providers to reroute vehicles, schedule operations more safely, and justify premium adjustments in insurance.
3. How Integration Works
Step 1: Data Acquisition via Telematics
Each vehicle in a fleet is equipped with telematics hardware that continuously sends data such as:
Time-stamped GPS coordinates
Speed and acceleration events
Collision notifications
Driver behavior analytics
Step 2: Spatial Correlation Using GIS
This telematics data is overlaid on geospatial layers using GIS. These layers can include:
Road infrastructure (curves, junctions, slopes)
Traffic density
Weather conditions
Crime rates
Historical accident data
Urban vs. rural classification
Step 3: Heatmap Generation
Incidents and high-risk driving behaviors are visualized as heatmaps, with color gradients indicating risk severity. For instance:
Red zones = high frequency of incidents
Yellow zones = moderate risk
Green zones = low risk
This enables real-time and predictive risk assessments for each route or region.
4. Applications and Benefits
a. Route Optimization
Heatmaps enable logistics operators to avoid high-risk areas by optimizing routes. This is particularly valuable in:
Urban logistics where congestion correlates with incident risk
Rural areas with poor road infrastructure
Industrial zones with high heavy-vehicle density
b. Insurance Premium Reduction
Insurers can use risk maps as evidence for customized premiums. Safer fleet operations backed by data can result in:
Lower accident claim frequency
Negotiated insurance discounts
Usage-based insurance (UBI) models tailored to real risk exposure
c. Driver Performance Management
By mapping high-risk driving behaviors to geographic locations, fleet managers can coach drivers to:
Avoid over-speeding in school zones
Take precautions at accident-prone junctions
Reduce risky maneuvers in identified hotspots
d. Incident Investigation and Liability Mitigation
Telematics and GIS provide geo-tagged, time-stamped records of incidents. In case of disputes, these records:
Support liability decisions
Provide transparent evidence for legal or insurance purposes
Reduce fraudulent claims
5. Technical Considerations
a. Real-time Data Ingestion
Efficient risk mapping systems require ingestion of high-frequency telematics data into GIS platforms. This necessitates:
Scalable cloud infrastructure
Low-latency data pipelines
Support for open geospatial standards (e.g., GeoJSON, WMS, WFS)
b. Spatial Analytics and Machine Learning
Advanced fleet risk platforms incorporate machine learning models that:
Detect patterns of repeated risk events
Predict future hotspots based on temporal and spatial trends
Correlate environmental data (e.g., fog, rainfall) with incident likelihood
c. Data Privacy and Security
As both driver behavior and location data are sensitive, secure handling is critical. Compliance with data protection laws (e.g., India’s Digital Personal Data Protection Bill) is essential.
6. Real-World Use Cases
Logistics Providers
A logistics company operating in India used fleet risk maps to reduce night-time accidents by 30%. By rerouting trucks away from poorly lit or accident-prone highways in Uttar Pradesh and Bihar, they optimized both safety and delivery efficiency.
Insurance Companies
An insurer integrated client fleet data with public accident records to refine premium structures for long-haul routes. Fleets operating predominantly in green zones were rewarded with lower premiums, encouraging data-sharing partnerships.
Smart Cities and Urban Planning
Municipal agencies use aggregated fleet incident maps to identify infrastructural blind spots, like poorly marked intersections or pothole-heavy stretches, and prioritize interventions.
7. Challenges to Implementation
Data Integration : Synchronizing telematics data with GIS layers across formats and providers.
Granularity : Overly broad data can miss micro-risks; overly granular data may overwhelm users.
Adoption Barriers : Small fleet operators may lack digital readiness or perceive high costs.
Bias and Interpretation : Inaccurate or incomplete data may skew risk visuals and decisions.
8. Future Trends
Edge Telematics : Real-time processing of incident alerts at the vehicle level before pushing to central GIS.
AI-Powered Dynamic Routing : Integration with AI models that adapt routes on the fly based on live heatmaps.
Crowdsourced Hazard Mapping : Using citizen input and mobile data to enhance GIS layers.
Integration with ESG Reporting : Risk mapping for fleet decarbonization, sustainability, and urban impact analysis.
Conclusion
Fleet risk mapping powered by the fusion of telematics and GIS is not just a technological upgrade, it’s a strategic asset. It transforms passive data collection into actionable spatial intelligence, enabling logistics operators to make safer, smarter, and more cost-effective decisions.
By embracing this integration, logistics companies can not only reduce incident-related costs and insurance premiums but also build a resilient and data-transparent logistics ecosystem ready for the future of mobility.