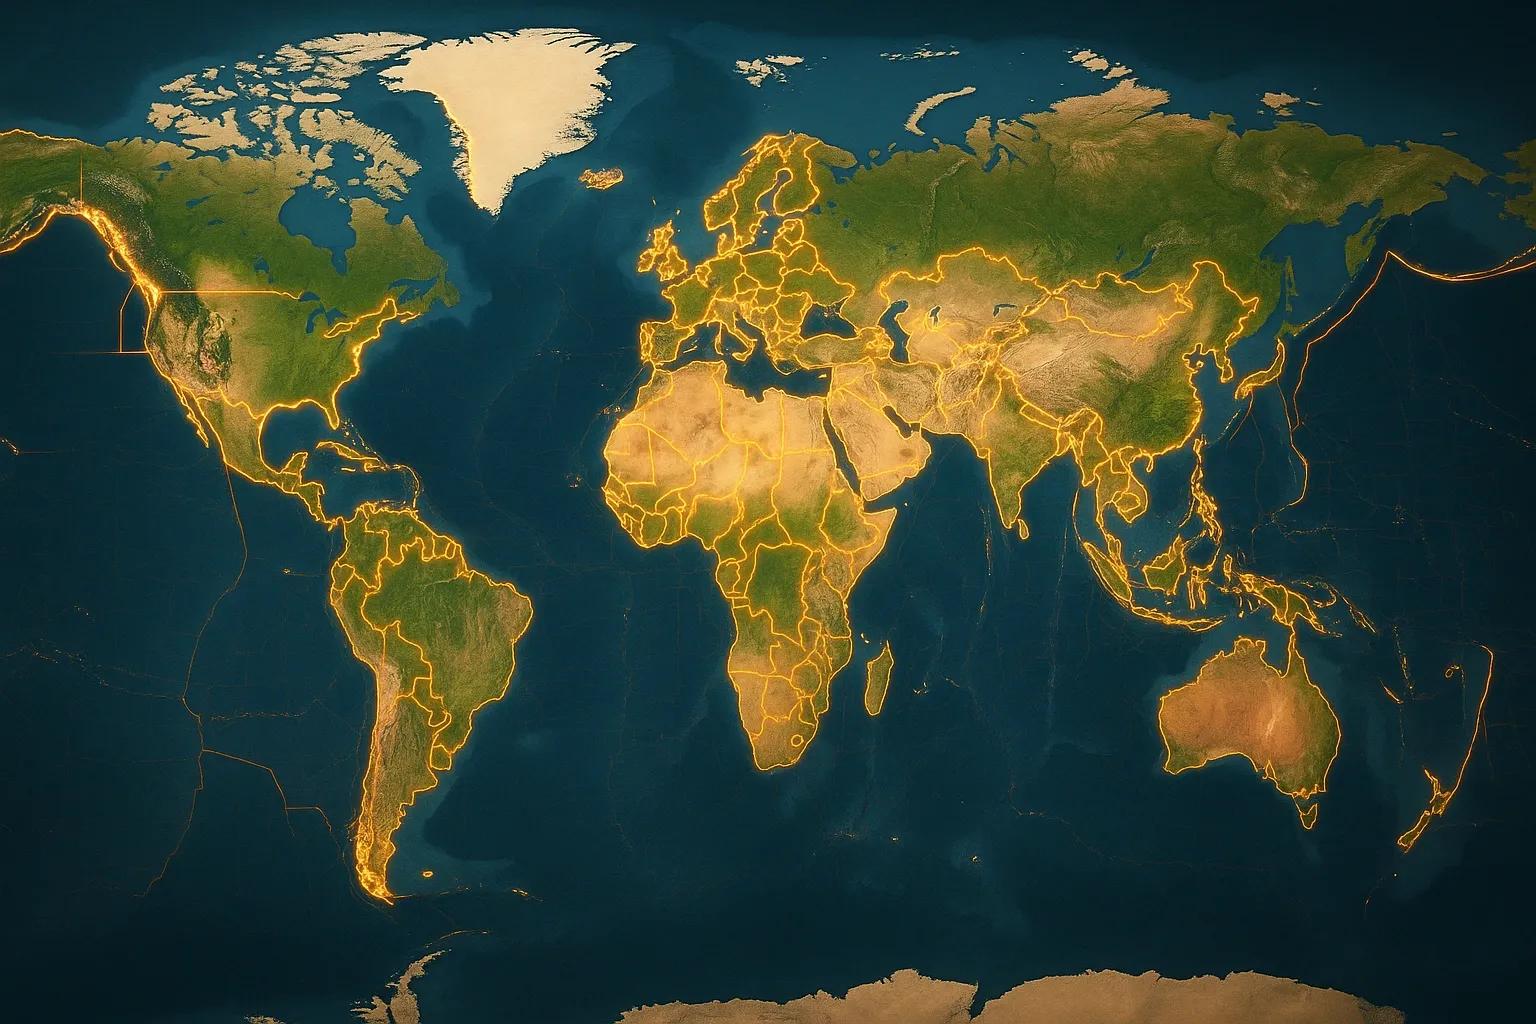
The Planet’s Vector Network Beneath Our Feet
If the lithosphere is Earth’s structural database, then tectonic plates are its vector layers , polygons and lines that define how the crust moves, collides, and reshapes itself over time. The boundaries between these plates aren’t just geological, they are geospatial boundaries in motion.
Much like how vector layers in a GIS define administrative zones or property parcels, tectonic plates define dynamic zones of interaction , constantly updated by the planet itself through deformation, subduction, and uplift.
Decoding Earth’s Geospatial Architecture
The Earth’s crust is divided into about 15 major plates and dozens of microplates. Each plate acts as a spatial entity with its own geometry, attributes, and motion vectors.
Boundaries as Polylines: Divergent, convergent, and transform boundaries can be mapped as linear features with directionality and velocity attributes.
Plates as Polygons: Each plate can be represented as a polygon with metadata, area, motion vector, angular velocity, stress zones.
Faults as Sub-Layers: Within each plate, fault networks define local deformation patterns, analogous to vector sub-layers that capture high-resolution spatial behavior.
These relationships transform tectonics from a geological abstraction into a living geospatial database , continuously updated by remote sensing and seismological data.
Digitizing Motion: From GPS to Remote Sensing
Modern geodesy allows us to quantify tectonic motion with precision that would have been unthinkable a few decades ago.
Global Navigation Satellite Systems (GNSS): Networks of GPS stations track plate movements at millimeter-level accuracy. India, for instance, moves northeast at approximately 5 cm/year as part of the Indian Plate pushing into the Eurasian Plate.
InSAR (Interferometric Synthetic Aperture Radar): Detects minute ground displacements over wide areas, critical for mapping fault creep and post-seismic deformation.
Seismic Tomography: Builds 3D models of Earth’s interior, helping refine the boundaries of plate interfaces.
By integrating these data streams, geoscientists maintain a near-real-time vector model of Earth’s crustal motion .
Amplifying the Understanding: Faults and Lineaments
Faults and lineaments are the fine print of tectonic geometry. While tectonic boundaries define macro-movements, faults represent local ruptures where energy is released. Lineaments, linear alignments visible in satellite imagery, often mark hidden or inactive fault traces.
Fault Mapping via Remote Sensing: Optical and radar imagery reveal subtle linear features, river offsets, escarpments, tonal variations, that correspond to fault lines.
Lineament Analysis: Automated extraction techniques (using edge-detection algorithms in GIS or machine learning) identify structural trends that guide mineral exploration, groundwater mapping, and hazard modeling.
Digital Fault Databases: Global datasets like USGS’s Global Faults and Folds Map or India’s GSI Seismotectonic Atlas provide vectorized records for multi-hazard risk assessment.
In geospatial analytics, these features function much like vector overlays that define constraints, risks, and opportunities across the landscape.
Case Example: The Indian Plate, A Living Laboratory
India sits at one of the world’s most complex tectonic intersections.
The Indian Plate collides with the Eurasian Plate , uplifting the Himalayas, a convergence boundary generating massive strain.
The Aravalli-Delhi Fold Belt and Godavari Graben act as deep-seated lineaments influencing seismicity and groundwater flow.
The Kutch Rift Zone in western India remains active, its faults mapped precisely using InSAR and GNSS after the 2001 Bhuj earthquake.
By maintaining a digital geospatial model of these interactions, scientists and planners can forecast hazard zones , guide infrastructure placement, and monitor crustal deformation.
From Geology to GeoAI: Automating Structural Detection
AI-driven geospatial analysis now enables automated extraction of lineaments and fault traces from high-resolution imagery.
Deep Learning on SAR and DEMs: Detects discontinuities using convolutional neural networks (CNNs).
Edge Detection + Vectorization: Converts pixel-based anomalies into vector geometries for integration in GIS.
Predictive Modelling: Combines terrain derivatives (slope, curvature) with fault density to map susceptibility zones.
This fusion of geology and GeoAI turns Earth’s structural data into continuously learning vector networks, dynamic, predictive, and scalable.
Implications for Infrastructure and Risk Management
Tectonic mapping isn’t just scientific; it’s deeply practical. Every spatial decision, whether for a dam, metro line, or data center, relies on understanding subsurface geometry.
Infrastructure Resilience: Overlaying fault maps with utility grids reduces seismic vulnerability.
Mining and Groundwater: Fault density analysis identifies fracture zones for resource targeting.
Urban Planning: Digital twins of cities can integrate subsurface vectors to simulate earthquake impacts.
In short, reading tectonic plates as vector layers helps engineer safety into the system design itself.
Outlook: Toward a 4D Vector Earth Model
Future Earth Twins will treat tectonic motion as time-aware vector data . Instead of static polygons, plates will be dynamic entities with evolving geometries. Real-time GNSS feeds, satellite data, and seismic sensors will feed into 4D models that visualize how stress propagates through the crust , predicting not just where movement happens, but when and how fast.
This vision transforms geology from a descriptive science into a continuous spatial simulation of planetary dynamics.
Conclusion
Tectonic plates aren’t static boundaries, they are dynamic vector layers in Earth’s spatial database , continuously shifting, interacting, and redefining the surface above.
By decoding, digitizing, and amplifying these patterns, we transform the invisible forces of geology into actionable intelligence for safer cities, resilient infrastructure, and deeper understanding of our planet’s evolution.