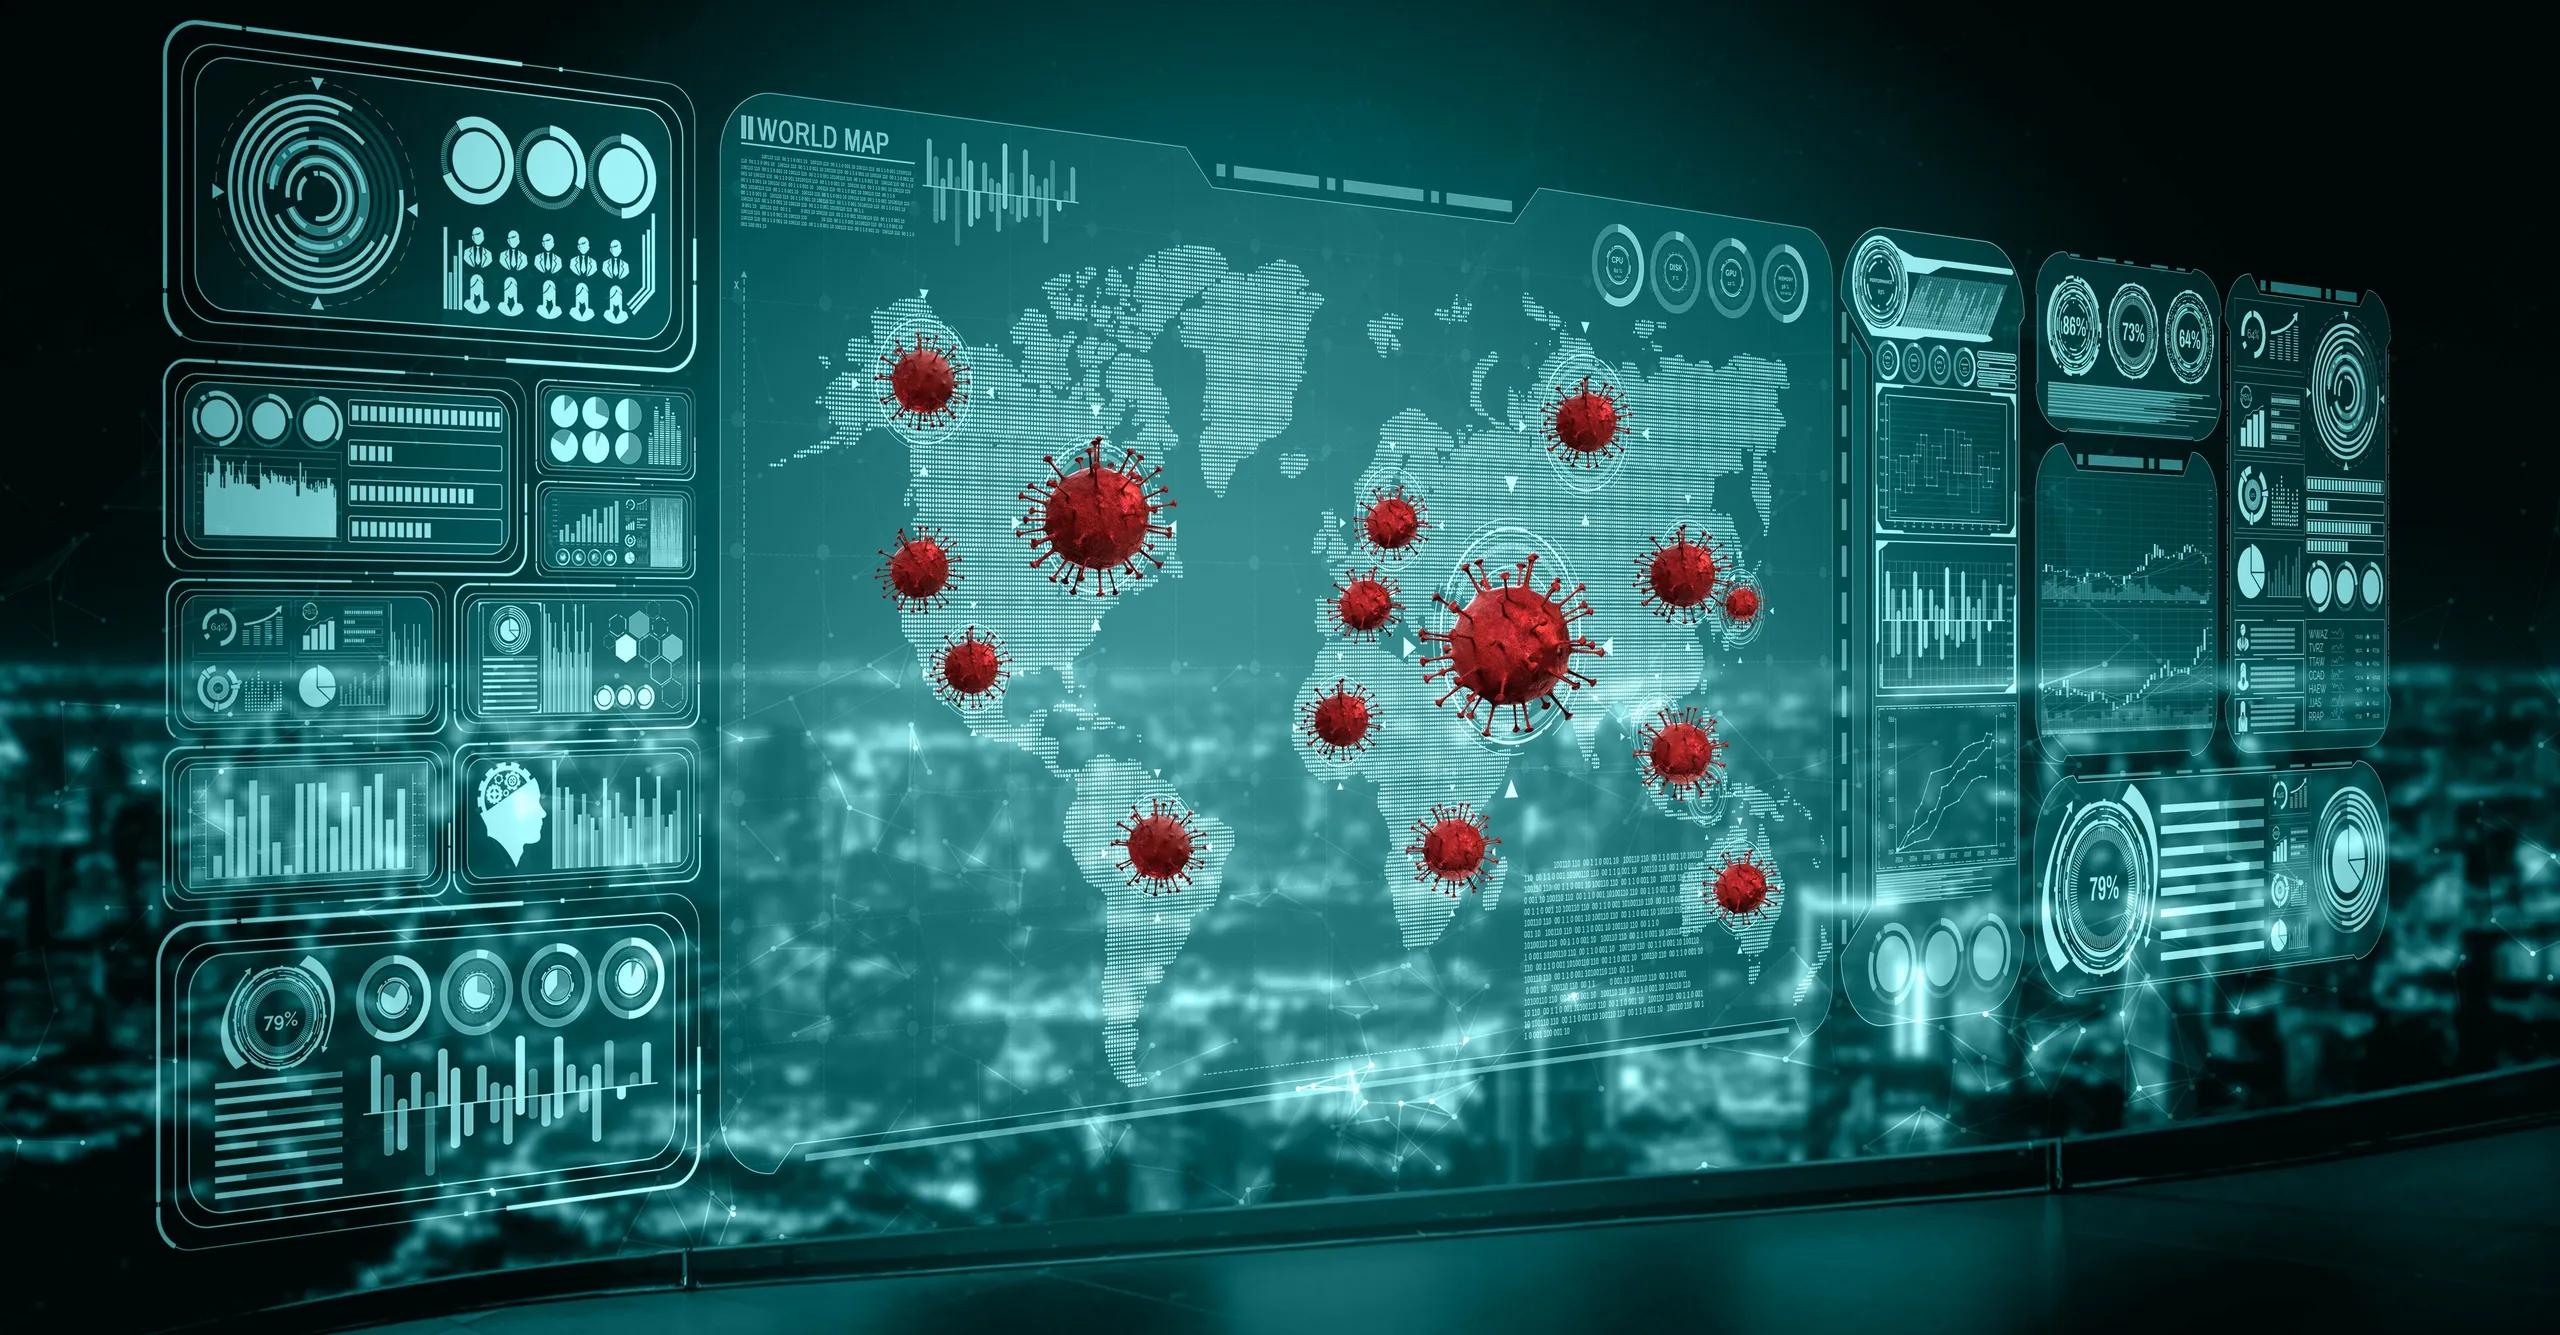
Disease surveillance in India is undergoing a digital transformation, with spatial analytics emerging as a powerful tool to detect, track, and mitigate public health threats. By integrating geographic information systems (GIS), remote sensing, and location intelligence, spatial analytics enables a more granular, timely, and actionable understanding of disease dynamics. In the Indian context, marked by diverse topographies, population densities, and healthcare access levels, this capability is especially critical.
This article explores the role of spatial analytics in disease surveillance, backed by real-world case studies from India. It explains how spatial data improves outbreak detection, guides resource allocation, and supports long-term public health planning.
What is Spatial Analytics in Disease Surveillance?
Spatial analytics refers to the process of analyzing geographic and location-based data to identify spatial patterns and relationships. In disease surveillance, this involves combining epidemiological data with geospatial datasets such as population density, climate variables, healthcare infrastructure, and land use.
Core components include:
Geo-tagged case data (e.g., from hospitals, mobile health units)
Environmental overlays (e.g., rainfall, temperature, vegetation)
Demographic and socioeconomic layers
Predictive modelling using machine learning and statistical tools
This geospatial intelligence enables proactive and targeted intervention, which is crucial in India's densely populated and often resource-constrained settings.
Case Study 1: Malaria Surveillance in Odisha Using GIS
Background : Odisha is a high-burden malaria state, especially in forested and tribal regions.
Solution : The Odisha State Malaria Control Program integrated GIS tools to map hotspots, vector habitats, and vulnerable populations. Spatial layers included:
Altitude and forest cover (from remote sensing)
Human settlements (census and satellite data)
Locations of Primary Health Centres (PHCs)
Historical case data from NVBDCP (National Vector Borne Disease Control Programme)
Outcome : Spatial clustering analysis (Getis-Ord Gi*) identified specific blocks where vector breeding was intensified due to stagnant water and canopy cover. Based on this, the state could:
Prioritize Indoor Residual Spraying (IRS)
Deploy Rapid Diagnostic Tests (RDTs) in remote areas
Align health outreach programs with seasonal transmission peaks
Impact : A 24% drop in confirmed malaria cases in GIS-targeted districts was observed within two years.
Case Study 2: COVID-19 Hotspot Tracking in Telangana and Karnataka
Background : During the COVID-19 pandemic, Indian states needed to implement dynamic containment strategies.
Solution : Telangana and Karnataka developed interactive dashboards using spatial analytics. These integrated:
Real-time case reports from hospitals and testing centers
Containment zone geofencing
Urban mobility data from telecom providers
Density heatmaps using ward-level population data
In Bengaluru, for instance, Bruhat Bengaluru Mahanagara Palike (BBMP) used spatial clustering tools to flag micro-containment zones at the street level.
Outcome :
Containment zones were dynamically redrawn based on real-time case density.
Ambulance routing was optimized using GIS layers to avoid red zones.
Door-to-door surveillance was focused on high-risk wards.
Impact : Reduced transmission rates in high-density wards and better deployment of medical resources (beds, ventilators, staff).
Case Study 3: Japanese Encephalitis (JE) and Waterbody Mapping in Assam
Background : Assam reports annual outbreaks of JE, primarily spread through mosquito vectors breeding in rice paddies and water bodies.
Solution : The National Remote Sensing Centre (NRSC) collaborated with state health departments to use Sentinel-2 and Landsat imagery to map potential vector breeding sites.
Key spatial datasets included:
NDWI (Normalized Difference Water Index) to identify stagnant water
Land use maps to track rice cultivation zones
GPS-enabled case tracking of affected children
Outcome :
Health authorities pre-emptively fumigated areas within 2 km radius of high-risk water bodies.
Pig-rearing clusters (JE reservoirs) were geo-tagged to regulate animal-human interactions.
Mobile health vans were deployed in targeted areas before the monsoon.
Impact : The state reported a 40% decline in JE cases over three years of implementing geospatial surveillance.
Case Study 4: Tuberculosis (TB) Case Mapping in Urban Slums of Mumbai
Background : TB in India is concentrated in urban slums due to overcrowding, poor ventilation, and limited access to health services.
Solution : The Municipal Corporation of Greater Mumbai (MCGM) used spatial analytics to map TB case density against urban morphology.
Layers included:
Building footprint density (from municipal GIS)
Ventilation and sunlight index
Health facility locations with Directly Observed Treatment (DOT) centers
Mobility and contact tracing logs
Outcome :
TB screening was expanded to informal settlements with high building density and poor sunlight access.
Mobile sputum collection kiosks were set up in under-served wards.
Public awareness campaigns were spatially targeted using data from GIS dashboards.
Impact : TB treatment adherence improved by 18%, and early detection rates increased by 27% in targeted areas.
Technical Tools and Platforms Used
Several geospatial platforms were used across these case studies:
QGIS and ArcGIS : For mapping, layering, and hotspot analysis
Google Earth Engine (GEE) : For remote sensing-based indices (NDVI, NDWI, etc.)
GeoAI models : Used in pilot projects for outbreak prediction
OpenStreetMap & Census APIs : For integrating demographic data
Mobile GIS apps : For real-time field data collection (e.g., KoboToolbox, Epicollect5)
Challenges and Gaps
Despite these successes, several challenges remain:
Data fragmentation : Health, environmental, and demographic datasets are managed by different departments, limiting integration.
Real-time access : Many surveillance systems lack live data feeds, leading to delayed responses.
Capacity : Limited GIS expertise at district and block-level public health offices.
Privacy concerns : Especially with mobile-based tracking and personal health data geotagging.
These issues highlight the need for institutional capacity building, data interoperability frameworks, and secure data governance.
Policy and Future Roadmap
India’s Integrated Health Information Platform (IHIP) is now incorporating GIS for disease surveillance across states. Other initiatives like the National Digital Health Mission (NDHM) can further enhance the spatial analytics layer by integrating individual health records with spatial metadata.
Suggested roadmap for scaling spatial analytics in disease surveillance includes:
Standardized spatial data layers : Ensure all health departments have access to high-resolution base maps, health infrastructure GIS layers, and environmental datasets.
Public health GIS units : Dedicated spatial analysts embedded within state health departments.
Training programs : Upskilling epidemiologists and public health workers in GIS tools and spatial thinking.
GeoAI integration : Use of AI models for outbreak forecasting, spatial regression, and real-time anomaly detection.
Open geospatial platforms : Adoption of platforms like India Urban Data Exchange (IUDX) to share cross-sectoral spatial data securely.
Conclusion
Spatial analytics is reshaping disease surveillance in India, offering a robust framework for early detection, targeted intervention, and long-term public health planning. The case studies from Odisha, Karnataka, Assam, and Maharashtra demonstrate how spatial intelligence can be integrated into disease control strategies across diverse contexts, from vector-borne diseases to airborne infections.
As India continues to digitalize its health systems, embedding spatial analytics into routine public health workflows will be key to building a resilient and proactive healthcare infrastructure. These data-driven approaches not only save lives but also optimize resources, improve service delivery, and build trust in the public health system.