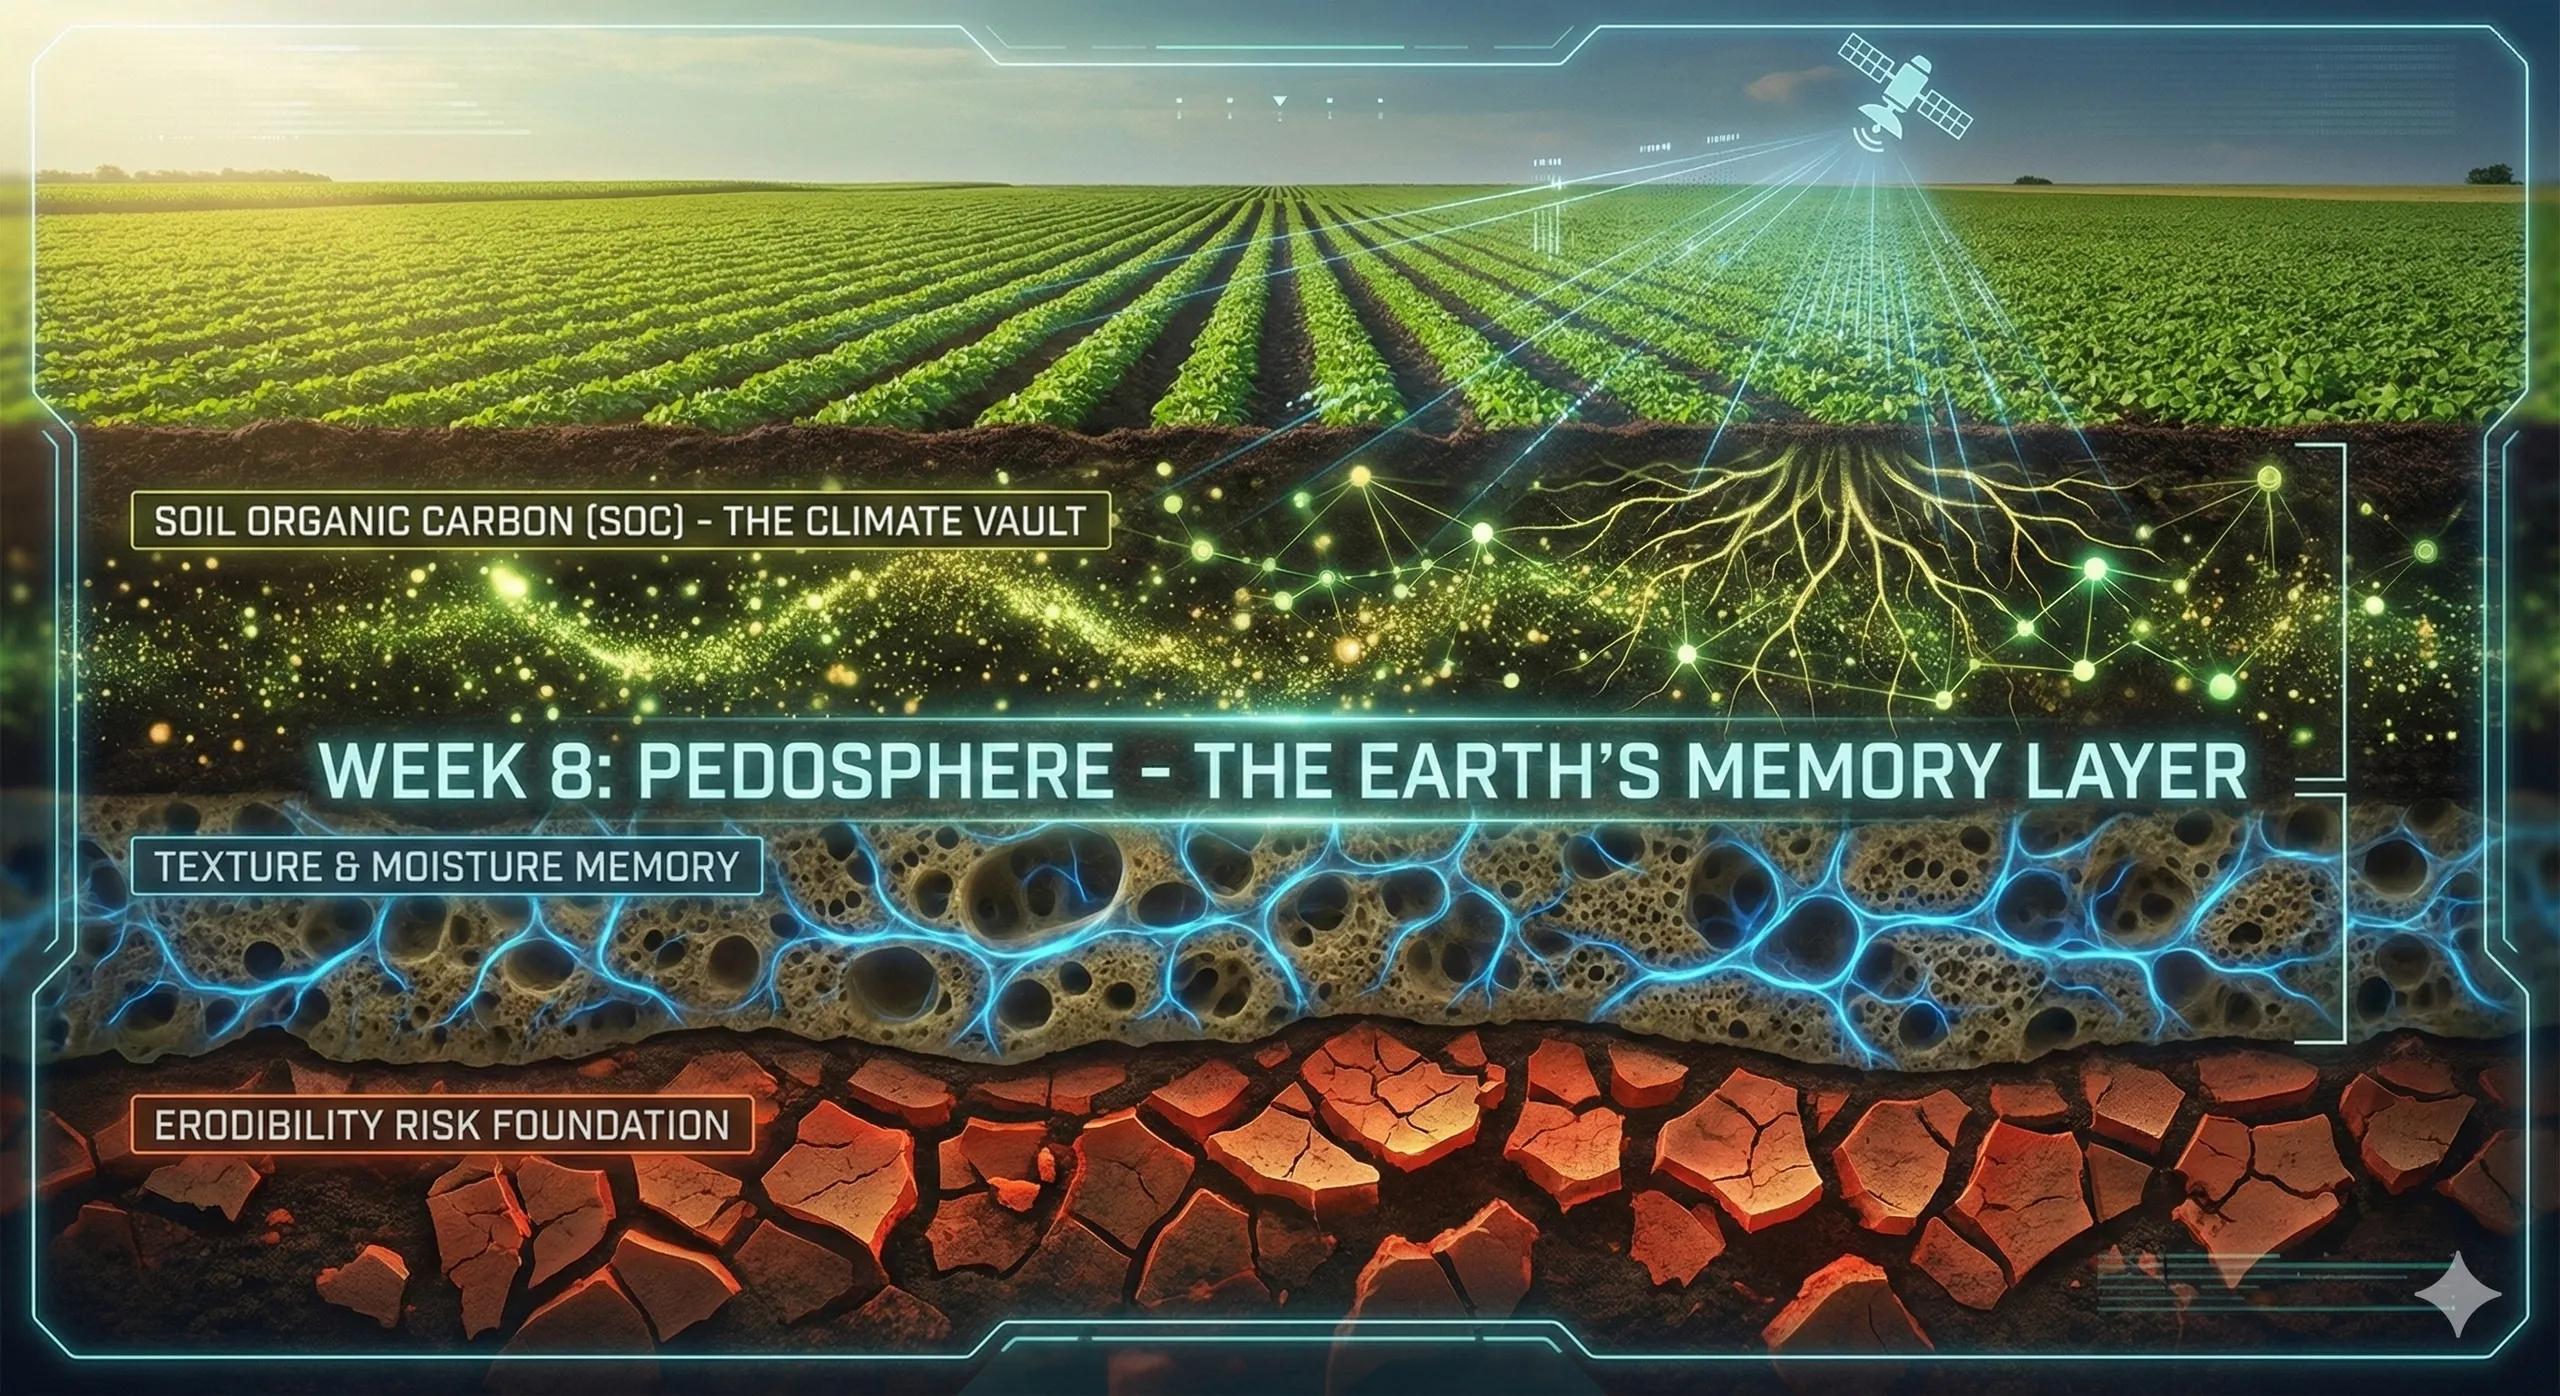
What if the ground beneath us is not just a surface, but a memory system recording centuries of climate, water, and human impact?
Soils are Earth’s memory layer .
They store the signatures of rainfall, temperature, vegetation, farming, erosion, carbon cycles, and even past climates.
In geospatial science, soil is not just a physical medium, it is a data archive coded in texture, organic carbon, moisture, minerals, and structure.
Understanding soils is fundamental for:
agriculture and food security
watershed management
climate adaptation
erosion modeling
carbon accounting
land restoration
infrastructure design
This article decodes soil texture, SOC, and erodibility as core geospatial layers.
1️⃣ Soil Texture: The First Signal of Land’s Past
Soil texture, the percentage of sand, silt, and clay , determines how land behaves.
Sand → Drains quickly but holds little nutrients
Found in alluvial plains, river terraces, coastal belts.
Silt → Fertile but vulnerable to erosion
Dominant in riverine landscapes.
Clay → Holds water and nutrients, but slow to drain
Common in black cotton soils (Vertisols), floodplains, and deep-weathered regions.
Spatial Mapping Sources
Sentinel-2 reflectance for surface texture
SoilGrids (250 m global dataset)
FSI and NBSS&LUP soil atlases
UAV multispectral for micro-variability
Texture influences:
crop suitability
infiltration
runoff generation
root depth
soil moisture retention
drought resilience
Soil texture is the foundation layer for any land management model.
2️⃣ Soil Organic Carbon (SOC): Earth’s Biological Memory
SOC is the most important soil health metric, the backbone of:
soil fertility
water storage
microbial activity
crop productivity
ecosystem resilience
carbon sequestration
It also acts as an indicator of past vegetation and land use .
Mapping SOC Geospatially
SOC is inferred using:
Sentinel-2 red-edge + NIR reflectance
Hyperspectral signatures (PRISMA, upcoming EnMAP)
SoilGrids SOC layers
Laboratory calibration datasets
Regression + ML models (RF, SVR, XGBoost)
Higher SOC zones correlate with:
forest soils
wetlands/peatlands
conservation agriculture
high biomass systems
cool, moist climates
Low SOC zones are red flags for degradation , over-cultivation , or erosion .
SOC as a Climate Layer
SOC is central to carbon markets :
baselines
sequestration rates
MRV workflows
soil carbon crediting
Soils are a carbon sink waiting to be quantified.
3️⃣ Erodibility (K-factor): Soil’s Vulnerability Score
Erosion is one of the biggest risks to topsoil, India loses ~16.4 tons per hectare per year in some regions.
Erodibility (K-value) comes from:
texture
structure
permeability
organic matter
slope and rainfall intensity (via RUSLE)
Sources for Mapping K-factor
NBSS&LUP soil series
RUSLE factor maps
Slope from DEMs
Rainfall erosivity (IMD, ERA5)
Land cover from Sentinel-2
Soil moisture dynamics from SMAP or Sentinel-1
High erodibility zones are found in:
Shivalik foothills
semi-arid farmlands
degraded forest margins
hill agriculture regions
sandy/silty soils with low SOC
Low SOC + high slope + high rainfall is the classic erosion hotspot triad.
4️⃣ Soil as a Layer in Earth System Modeling
Soil intelligence underpins:
Hydrology models (runoff, infiltration, recharge)
Agricultural advisories (crop choice, fertilizer inputs)
Land degradation alerts
Slope stability and landslide risk
Irrigation planning
Groundwater recharge zones
Carbon stock estimation
Every Earth-model starts with soil, because soil controls how the surface stores and moves water, carbon, and energy.
5️⃣ GeoAI for Soil Intelligence
AI-enhanced soil modelling uses:
CNNs to interpret spectral textures
LSTM for soil moisture time-series
XGBoost/LightGBM for SOC predictions
U-Net for erosion scar detection
Bayesian ML for uncertainty quantification
GeoAI fuses:
biophysical data
terrain
climate signals
land management patterns
The result: soil prediction maps far more accurate than lab-only models.
6️⃣ India’s Soil Data Landscape, Strengths and Gaps
Strengths:
NBSS&LUP soil atlases
Soil Health Card data
Bhuvan LULC layers
SMAP/Sentinel-1 moisture datasets
ICAR soil research networks
Gaps:
parcel-level soil data
SOC baselines for carbon markets
real-time soil moisture intelligence
erosion monitoring network
lack of district-level soil twins
Soil-based decision-making is still largely static , not operational.
7️⃣ Toward a Soil Digital Twin
A Soil Twin integrates:
texture
SOC
moisture
structure
depth
erodibility
crop history
weather
degradation hotspots
carbon flux
irrigation patterns
This twin can simulate:
seasonal erosion risk
SOC gain/loss under various practices
expected crop response
recharge potential
climate-driven soil shifts
MRV-ready carbon scenarios
This becomes the earth-layer intelligence for agriculture, climate policy, and watershed interventions.
Conclusion
Soils are not passive.
They are memory layers shaped by centuries of climate, vegetation, and human decisions.
By mapping texture, SOC, and erodibility through geospatial datasets and GeoAI, we move from soil observation → soil intelligence → soil digital twins.
Healthy soils = healthy watersheds, healthy crops, healthy carbon cycles.
In the planet’s story, soil is the page most worth reading.