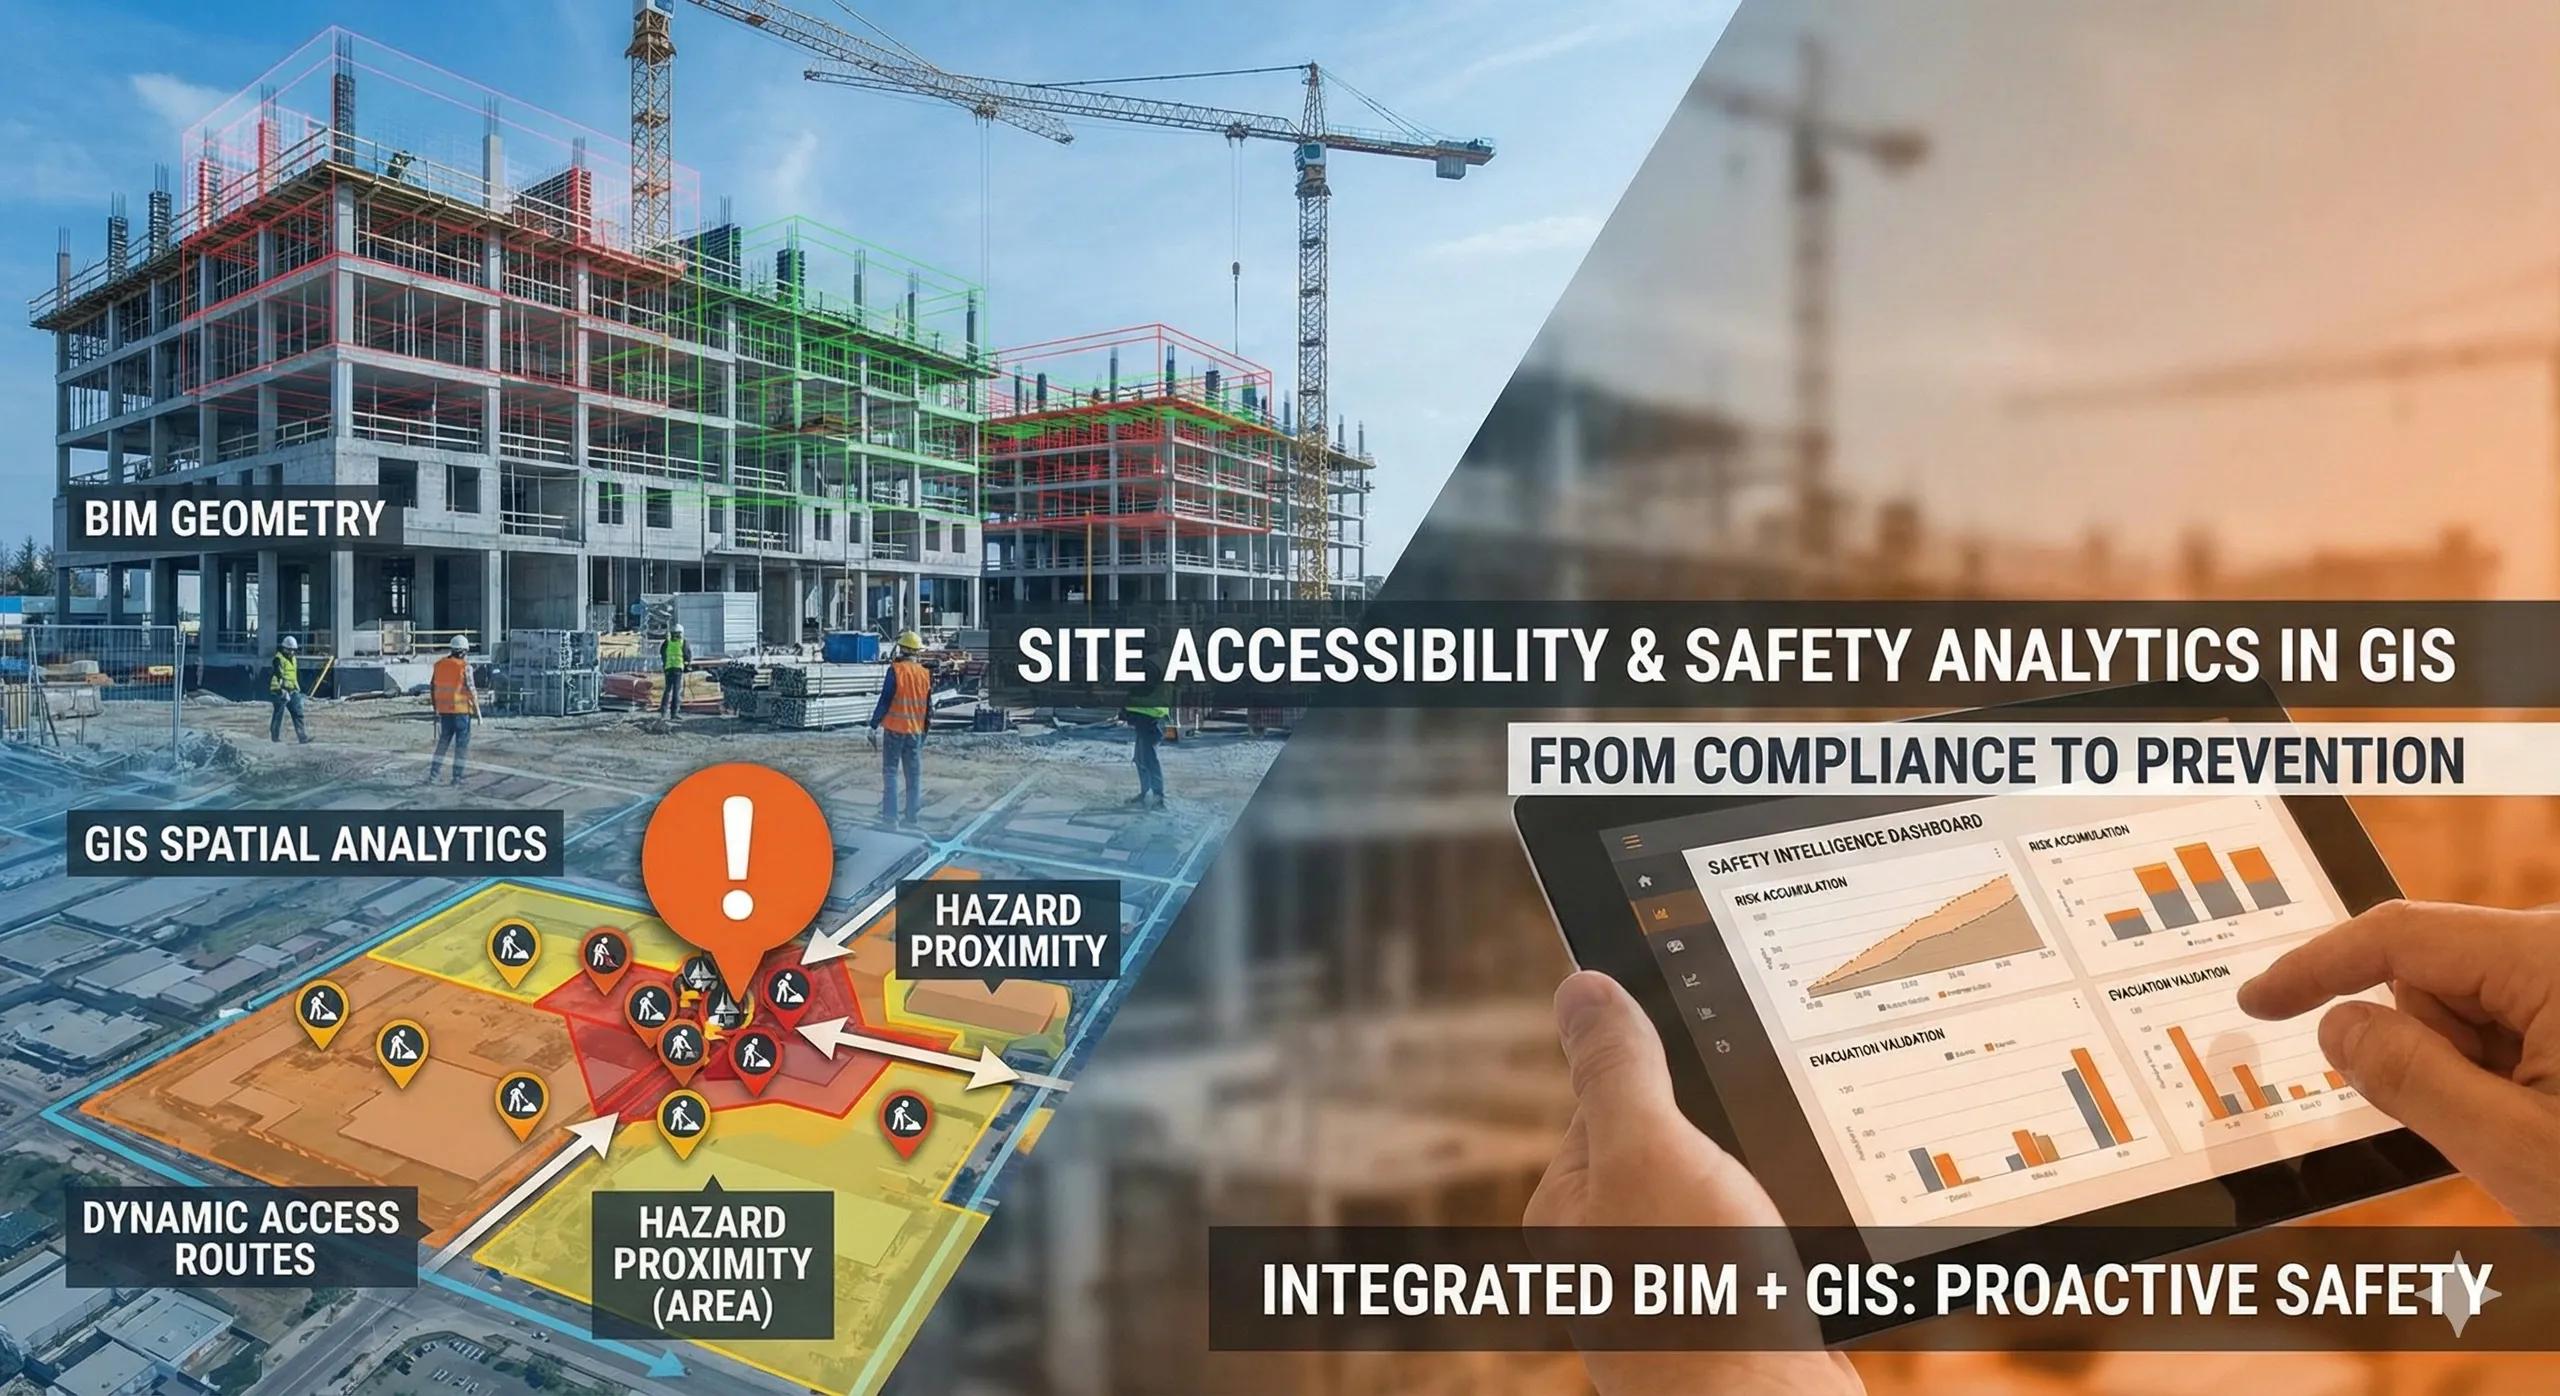
Most safety incidents on construction sites are not caused by faulty design or lack of training.
They are caused by poor visibility of spatial risk .
Blocked access routes. Unsafe slopes. Congested work fronts. Emergency paths that exist on drawings but not on the ground. These issues are rarely invisible, they are just not analyzed spatially .
This is where GIS-based accessibility and safety analytics transforms safety from compliance into prevention.
1. Why Safety Breaks Down at the Site Level
On many projects:
Access plans are static
Safety zones are drawn once and forgotten
Site conditions change daily
But sites are dynamic systems:
Terrain evolves
Temporary works shift
Logistics routes change
Weather alters risk
Static safety plans cannot keep up with moving risk.
2. Accessibility Is a Spatial Question First
Accessibility depends on:
Terrain slope and stability
Path width and clearance
Surface condition
Proximity to hazards
Time-of-day and weather
If access is not evaluated spatially, safety decisions are based on assumption.
3. What GIS Adds to Site Safety
GIS enables:
Continuous mapping of safe and unsafe zones
Dynamic access-route analysis
Identification of congestion hotspots
Proximity analysis to hazards (edges, lifts, heavy equipment)
Scenario testing for emergency evacuation
This shifts safety from reactive to predictive .
4. Integrating BIM Geometry with Safety Context
BIM provides:
Accurate asset geometry
Work-front boundaries
Temporary structure locations
GIS provides:
Spatial analytics
Terrain intelligence
Network routing
Environmental context
Together, they allow safety teams to understand:
Where people can move
Where they should not
How risks change over time
5. Temporary Works Are the Biggest Blind Spot
Scaffolding, ramps, walkways, and barricades:
Control daily movement
Change frequently
Are rarely updated in models
Treating temporary works as spatial layers , not sketches, dramatically improves safety visibility.
6. Emergency Planning Needs Real Spatial Intelligence
Emergency plans often assume:
Clear paths
Stable conditions
Ideal visibility
Reality rarely matches.
GIS-based analytics allow teams to:
Validate evacuation times
Identify bottlenecks
Test alternate routes
Adjust plans seasonally
Preparedness is spatial, not procedural.
7. India Context: Why This Is Critical
On Indian sites:
Density is high
Mixed traffic is common
Informal movement paths emerge
Monsoon conditions rapidly change risk
Spatial safety analytics help:
Reduce incident likelihood
Improve coordination
Support compliance with fewer surprises
8. Safety Dashboards vs Safety Intelligence
Dashboards show:
Counts
Checklists
Lagging indicators
Spatial intelligence shows:
Where risk accumulates
How it moves
Who is exposed
The difference is between reporting incidents and preventing them .
9. From Compliance to Care
When accessibility and safety are analyzed spatially:
Safety teams gain foresight
Site managers gain clarity
Workers gain safer environments
This is safety designed into operations, not enforced after the fact.
10. A Simple Safety Rule
If you can’t map how people move safely across the site today, you’re managing yesterday’s risks.
Conclusion
Site safety is not just a policy issue.
It is a spatial intelligence problem .
When GIS-based accessibility and safety analytics are integrated with BIM:
Risks surface early
Access improves
Emergency readiness increases
Safety becomes proactive
In complex, fast-changing sites, knowing where risk lives is the first step to eliminating it .