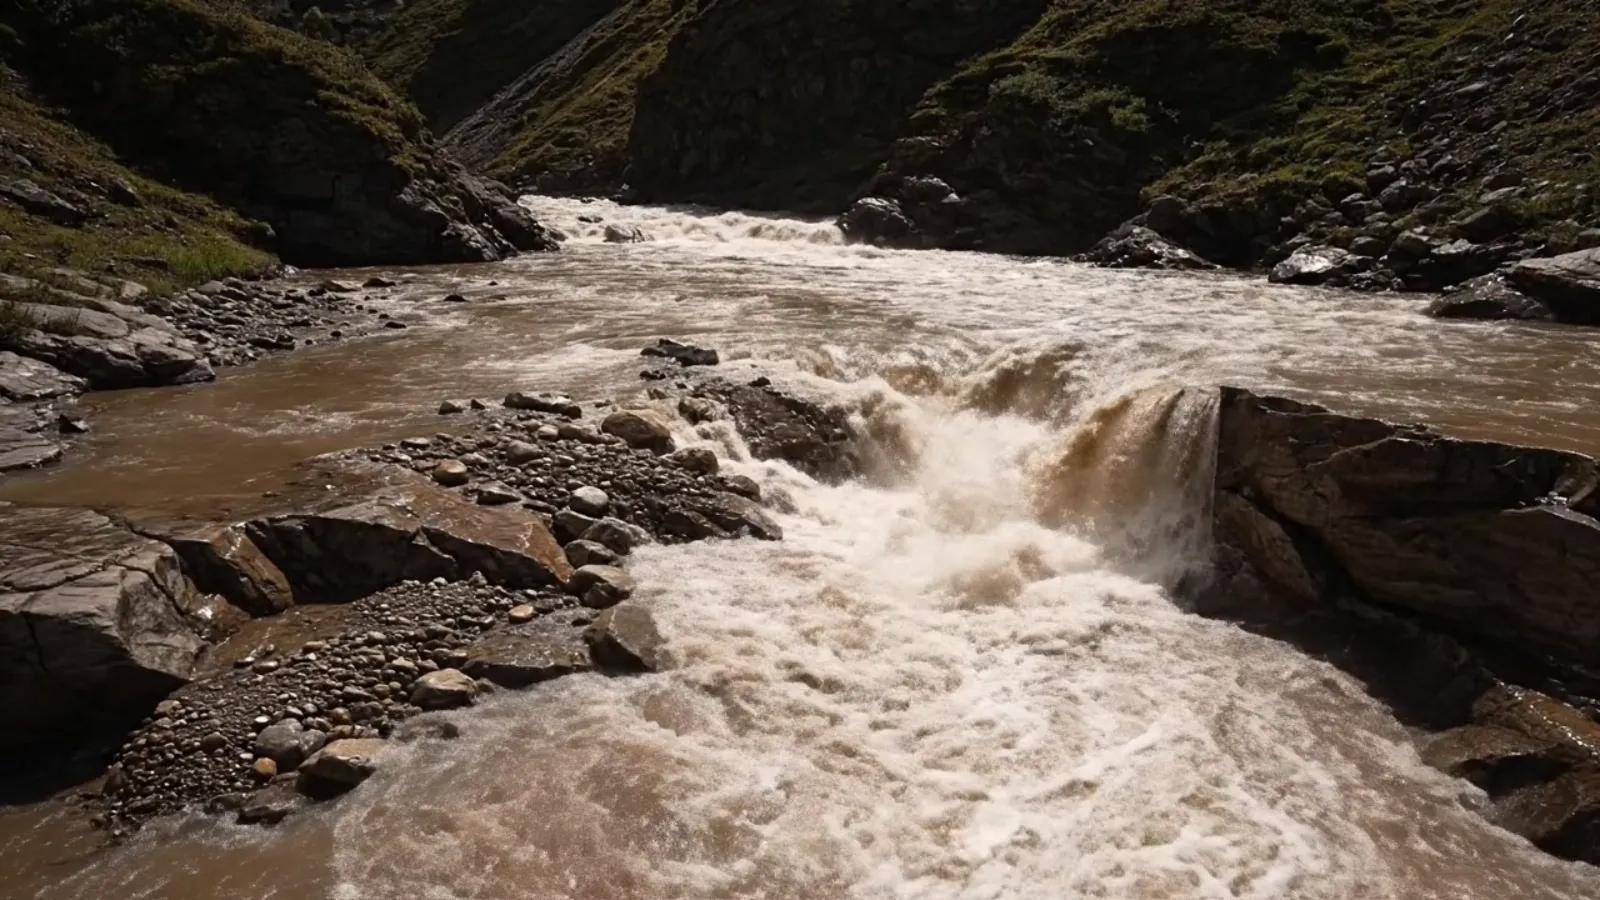
The Planet’s Sculpting Algorithm
Every contour, canyon, and valley you see is the result of a quiet, continuous computation, erosion .
Rivers act as the planet’s carving tools, transforming elevation into energy and sediment into architecture.
In geospatial science, this translates into river incision (vertical erosion) and sediment budget analysis (tracking material movement), together forming the process layer that connects topography, hydrology, and geomorphology.
When mapped through DEMs and remote sensing, erosion becomes quantifiable, turning what once took millennia to observe into measurable annual trends.
River Incision: The Pulse of a Landscape
River incision is the downward cutting of a river channel into bedrock or alluvium. It reflects the balance between tectonic uplift , climate-driven discharge , and rock resistance .
In GIS terms, incision represents the vertical component of landscape evolution , the planet’s Z-dimension in motion.
Key measurable parameters:
Channel Gradient (S): Derived from DEM slope along flow lines.
Stream Power Index (SPI = As × S): Combines drainage area (As) and slope (S), proxy for erosive potential.
Knickpoints and Longitudinal Profiles: Breaks in profile reveal uplift zones or lithologic contrasts.
Incision Rate (di/dt): Change in bed elevation over time from LiDAR or repeat DEMs.
High incision rates mark active landscapes , tectonically or climatically energized, whereas low rates suggest geomorphic equilibrium.
Sediment Budgets: Tracking Earth’s Material Economy
Just as finance tracks cash flow, geomorphology tracks sediment flow , input, storage, and output within a drainage basin.
A sediment budget quantifies how much material erodes, moves, and deposits over time.
Core components:
Source (Erosion zones): Hill slopes, gullies, mass wasting.
Transfer (Transport pathways): Channels, floodplains, debris flows.
Sink (Deposition areas): Deltas, reservoirs, estuaries.
Sediment Budget Equation: ΔS = P – (E + T) where ΔS is change in sediment storage, P is production, E is export, and T is temporary storage.
Remote sensing enables quantifying each term, measuring sediment yield , transport capacity , and net erosion across scales.
Mapping the Process with Geospatial Tools
Modern remote sensing and GIS integrate multiple data sources to visualize erosion as a dynamic layer:
DEM Derivatives: Slope, curvature, flow accumulation → quantify erosive potential.
Satellite Imagery: NDVI decline or bare soil index tracks exposed surfaces and soil loss.
Sediment Load Estimates: Turbidity from Sentinel-2 , MODIS , or Landsat reflectance bands.
River Morphodynamics: Change detection from historical imagery maps meander migration and channel incision.
Reservoir Sedimentation: Multi-temporal volume change from bathymetry + LiDAR/DEM differencing.
By merging these datasets, geospatial analysis converts erosion from a static concept into a spatiotemporal dataset , an evolving indicator of landscape health.
Quantifying Sediment Connectivity
Not all eroded sediment reaches the outlet. Sediment connectivity models describe how efficiently materials move through a catchment.
The Borselli Index (IC) , derived from DEMs, combines upslope contributing area and downslope impedance to quantify connectivity.
High-connectivity zones (e.g., steep, bare slopes) rapidly transfer sediment; low-connectivity areas (dense vegetation, gentle relief) act as buffers.
Such indices guide land management , soil conservation , and reservoir siltation mitigation .
Case Example: Himalayan Basins
In the central Himalayas, incision rates often exceed 5 mm/year , among the highest globally. DEM differencing and InSAR data reveal active channel downcutting, driven by high uplift and monsoon intensity.
Data stack: CartoDEM, Sentinel-2 (turbidity), IMERG rainfall, GSI lithology.
Findings: Steep, fractured lithologies with low NDVI correspond to maximum erosion yield.
Application: Prioritized slope stabilization and sediment trap design to reduce downstream flood sedimentation.
Conversely, in peninsular India (e.g., Deccan rivers), incision rates are <0.1 mm/year, landscapes largely shaped by slow denudation and structural control.
Erosion as a Risk Multiplier
Uncontrolled erosion undermines infrastructure, agriculture, and ecosystems. Integrating incision and sediment data into risk frameworks helps planners:
Identify high-erosion corridors affecting roads and reservoirs.
Forecast delta siltation and coastal geomorphology shifts.
Design catchment-based sediment management plans.
Feed disaster models (landslide, flood, debris flow) with terrain-derived erosion factors.
Erosion, once seen as background noise, is now recognized as a first-order control on sustainability and resilience.
GeoAI for Process Prediction
AI models are now learning to predict erosion and sediment flux directly from satellite imagery and terrain metrics:
CNNs on DEM + NDVI + rainfall predict erosion hotspots.
Time-series models forecast sediment yield from rainfall anomalies.
Hybrid Digital Twins integrate real-time sensor and satellite data to update sediment budgets continuously.
This marks a shift from static erosion mapping to dynamic process modeling , closing the loop between observation and action.
Outlook: From Observation to Management
By 2030, large-scale erosion digital twins may track terrain change in near real-time, integrating LiDAR, SAR, IoT gauges, and hydrological models.
These systems will not just map how the Earth is shaped, but help govern how we respond, guiding soil conservation, reservoir design, and climate adaptation policies.
Erosion is no longer just a process, it’s an indicator of planetary function.
Conclusion
River incision and sediment budgets reveal how energy flows through landscapes.
When viewed through geospatial analytics, erosion becomes not just an outcome, but an active data layer driving design, planning, and resilience.
We’re no longer watching rivers cut through land; we’re watching the planet shape its future, pixel by pixel, grain by grain.