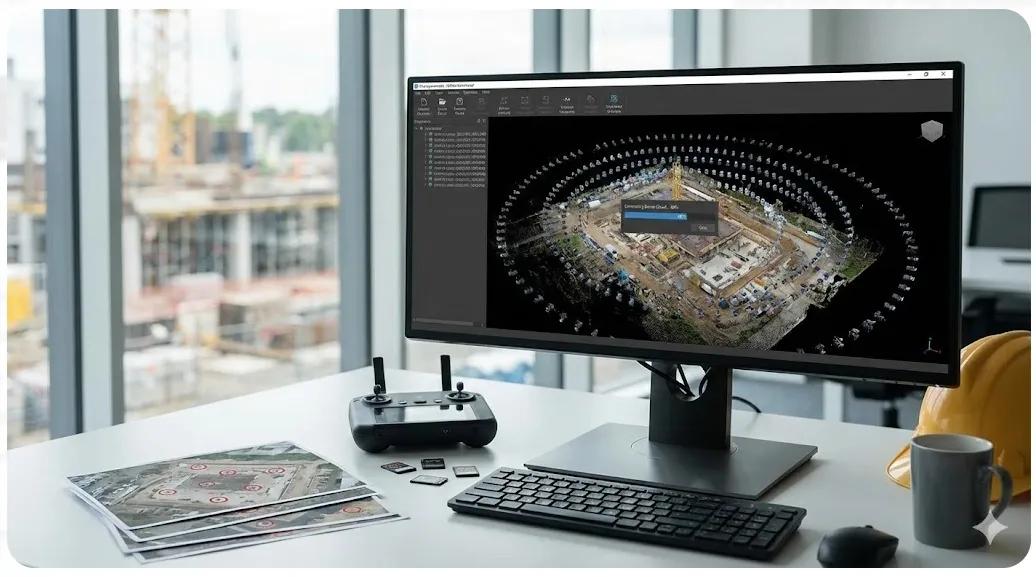
Photogrammetry is often misunderstood as a “drone output.” In reality, it is a data processing pipeline , one that transforms overlapping images into metrically reliable 3D information that can align with BIM and support field decisions.
When photogrammetry is treated as a black box, teams end up with visually impressive models that fail basic questions of scale, alignment, and accuracy. When treated as an engineered pipeline, photogrammetry becomes a powerful bridge between site reality and BIM intent.
This article explains how photogrammetry pipelines actually work , where errors creep in, and what must be controlled to turn images into scaled, BIM-aligned models .
1. Why Images Alone Are Not Data
A single image contains no depth.
Depth emerges only when:
Images overlap
Camera positions are solved
Geometry is reconstructed through triangulation
Without a disciplined pipeline:
Scale drifts
Models warp
Vertical accuracy collapses
BIM alignment fails
Photogrammetry is not photography.
It is computational geometry .
2. The Core Stages of a Photogrammetry Pipeline
A field-grade photogrammetry workflow consists of six tightly coupled stages .
Stage 1: Image Acquisition
Everything downstream depends on capture quality.
Key principles:
70–80% forward overlap
60–70% side overlap
Consistent altitude
Stable lighting (avoid long shadows)
Sharp focus and correct exposure
Poor capture cannot be fixed in processing.
Stage 2: Camera Pose Estimation (Structure from Motion)
The software:
Identifies common features
Solves camera positions
Builds a sparse point cloud
This stage defines:
Relative geometry
Initial model orientation
Without control points, this model is floating and unscaled .
Stage 3: Scaling & Georeferencing
This is where many workflows fail.
Scaling requires:
GCPs or checkpoints
Known distances
Accurate vertical datum
At this stage:
The model is tied to a real CRS
Scale becomes absolute
BIM alignment becomes possible
Without this step, models may look right but be wrong by meters .
Stage 4: Dense Point Cloud Generation
The pipeline converts sparse geometry into:
Millions of 3D points
Surface representations
True site geometry
Point density affects:
Deviation analysis
Volume calculations
Surface accuracy
More points ≠ more accuracy if scaling is wrong.
Stage 5: Mesh & Surface Creation
Meshes are generated for:
Visualization
Progress tracking
As-built comparison
Important distinction:
Meshes are interpretive
Point clouds are authoritative
Field decisions should rely on point clouds , not textured meshes.
Stage 6: Deliverables for BIM Integration
Photogrammetry outputs must be filtered and formatted:
LAS/LAZ point clouds
Orthomosaics
DSM/DTM
Clipped datasets aligned to BIM zones
Raw outputs overwhelm BIM workflows if not curated.
3. Where Photogrammetry Pipelines Commonly Break
Most failures occur at predictable points:
Insufficient image overlap
Inconsistent lighting conditions
Missing or poorly surveyed GCPs
Ignoring vertical datum
Over-reliance on meshes
No accuracy reporting
Each issue reduces trust in the final model.
4. Accuracy vs Resolution: A Critical Distinction
High-resolution imagery does not guarantee accuracy.
Resolution = visual sharpness
Accuracy = geometric correctness
Field workflows depend on accuracy , not aesthetics.
Always validate:
Horizontal RMSE
Vertical RMSE
Checkpoint error
If accuracy is unknown, data should not drive decisions.
5. Photogrammetry vs LiDAR (Revisited)
Photogrammetry excels at:
Large-area coverage
Texture-rich surfaces
Earthworks
Progress visualization
It struggles with:
Featureless surfaces
Thin elements
Interiors
Tight tolerances
This reinforces why photogrammetry is complementary , not standalone.
6. Integrating Photogrammetry With BIM
For BIM-to-field alignment:
Point clouds must share CRS with BIM
Vertical datum must match project standards
Datasets must be clipped to relevant zones
Deviations must be measured, not eyeballed
Photogrammetry supports BIM only when alignment is explicit .
7. Frequency and Purpose Alignment
Capture frequency should align with decisions:
Weekly → earthworks, progress
Milestone-based → structural validation
Targeted → deviation analysis
Capturing too often without purpose adds noise, not value.
8. Photogrammetry as a Digital Twin Input
When scaled and validated, photogrammetry provides:
Time-stamped geometry
Change detection
Volume trends
Progress verification
This temporal layer is essential for construction-phase digital twins .
9. A Practical Field Test
Before using photogrammetry for BIM decisions, ask:
Can this dataset be measured, aligned, and defended in a coordination meeting?
If not, it is still a visual product, not engineering data.
Conclusion
Photogrammetry is not a drone deliverable, it is a precision pipeline .
When treated correctly:
Images become measurable geometry
Reality aligns with BIM
Deviations are quantified
Field decisions gain confidence
When treated casually:
Models drift
Trust erodes
BIM workflows fail
In BIM-to-field execution, scaled reality matters more than beautiful visuals .
Photogrammetry succeeds only when images are transformed into controlled, verified, and aligned models .