The Rhythm of the Living Planet
Every ecosystem, crop, and forest follows a rhythm, a biological clock written not in time, but in color and reflectance.
This rhythm, captured from space through satellite sensors, is called phenology , the study of how vegetation grows, flowers, senesces, and renews in response to climate.
From NDVI (Normalized Difference Vegetation Index) curves, scientists can now observe the Earth breathing, pixel by pixel, season by season.
And beyond observation, phenology analytics are now driving real-world actions, from crop advisories to forest carbon accounting.
The Science: Reading Nature’s Pulse through NDVI
NDVI measures how green and photosynthetically active vegetation is:
NDVI = (NIR - Red) / (NIR + Red)
Where:
NIR (Near Infrared) reflects vegetation structure,
Red captures chlorophyll absorption.
Values range from -1 to +1 , with:
>0.5 → dense, healthy vegetation
0.2–0.5 → sparse or stressed vegetation
<0.1 → bare soil or non-vegetated areas
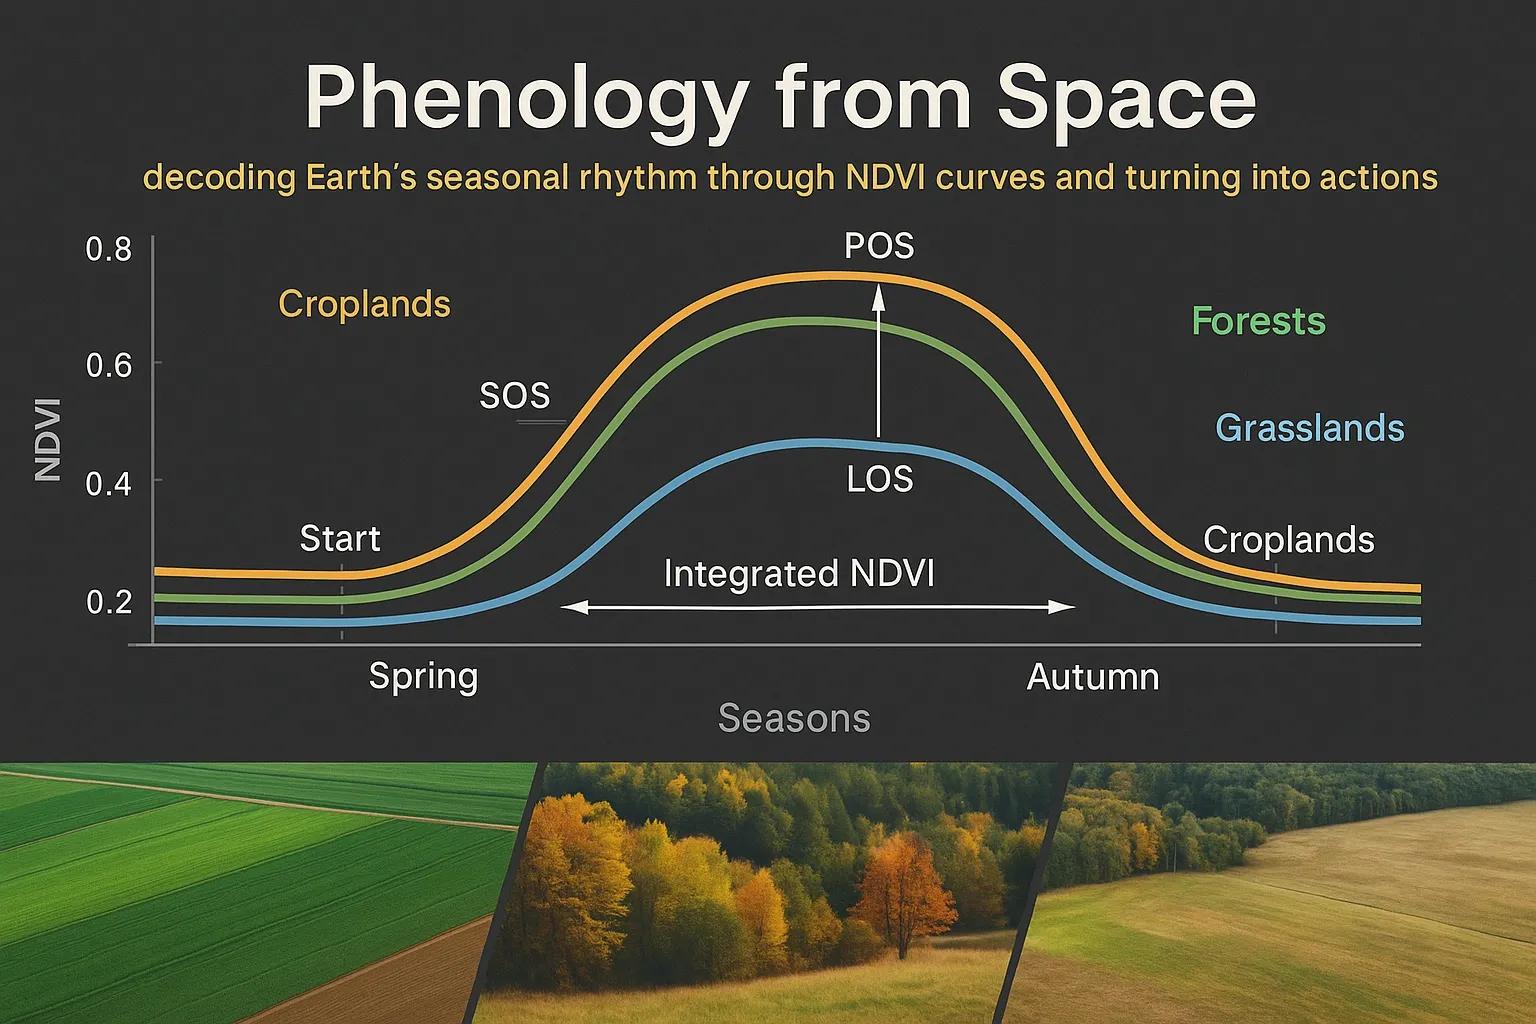
Tracking NDVI through time reveals the phenological cycle , growth, maturity, senescence, dormancy, for every landscape unit on Earth.
Phenology Metrics from NDVI Time Series
When NDVI data is plotted as a time series (weekly or bi-weekly), it forms a seasonal curve that can be analyzed for key transition points:
Metric - Meaning - Derived From
Start of Season (SOS) - Onset of greenness - NDVI increase beyond baseline threshold
Peak of Season (POS) - Maximum productivity - NDVI maximum value
End of Season (EOS) - Onset of senescence - NDVI fall below threshold
Length of Season (LOS) - Duration of active growth = EOS – SOS
Integrated NDVI (iNDVI) - Total productivity - Area under NDVI curve
These parameters together build the phenological fingerprint of any region, the timing and vigor of its biological activity.
The Data Stack: Watching Growth from Orbit
India’s phenological monitoring relies on a combination of multi-temporal, multi-sensor data streams :
Sensor - Resolution - Frequency - Use Case
MODIS (Terra/Aqua) - 250–500 m - Daily - Long-term vegetation trends
Sentinel-2 MSI - 10–20 m - 5 days - Crop-level phenology & stress detection
PlanetScope - 3–5 m - Daily - Precision agriculture & plantation monitoring
NOAA AVHRR / VIIRS - 1 km - Daily - Regional drought & greenness anomalies
Combined through cloud platforms like Google Earth Engine , these datasets allow for near-real-time monitoring of vegetation growth cycles across agro-ecological zones.
India’s Green Rhythms
India’s diverse biomes show distinctly different NDVI patterns:
Kharif crops (rainfed): Sharp NDVI rise (June–October), drop post-harvest.
Rabi crops: Gradual rise (December–March), reflecting irrigation support.
Evergreen forests (Western Ghats, NE states): Stable high NDVI year-round.
Grasslands (Central India): Rapid oscillations, short, intense growing phases.
Analyzing these patterns across 20 years reveals both climate-linked shifts and human management impacts , such as delayed sowing, shorter growing periods, or intensified double cropping.
Case Example: NDVI-Based Crop Calendar Optimization
In 2023, a project in Maharashtra’s semi-arid zones used Sentinel-2 NDVI curves to refine sowing advisories for soybean and cotton. Findings:
Mean Start of Season shifted by +10 days over the decade due to delayed monsoons.
Farmers adopting advisory-based sowing achieved 8–12% higher yields .
The model also identified areas of early senescence linked to water stress.
This NDVI-driven advisory was later integrated into the Gramin Krishi Mausam Sewa (GKMS) dashboard for operational rollout.
Beyond Agriculture: Forest and Ecosystem Phenology
Phenology isn’t just about crops, it’s central to ecosystem monitoring :
Forests: Detecting stress, canopy loss, and regrowth after fire or drought.
Wetlands: Tracking floodplain vegetation cycles and water–plant interactions.
Urban areas: Quantifying seasonal greening and urban tree health.
Carbon flux models: Linking NDVI-based phenology with GPP (Gross Primary Productivity) to estimate ecosystem carbon uptake.
In forest carbon projects, NDVI curves act as verification tools , showing whether restoration plots are growing as planned.
GeoAI and Phenological Forecasting
Machine learning now enhances NDVI-based phenology analysis:
LSTM Networks: Predict SOS and POS using multi-year time series.
Random Forests: Correlate phenology shifts with rainfall and temperature.
Anomaly Detection Models: Identify deviations (early senescence, delayed greening) linked to drought or pest stress.
Crop Classification via NDVI Profiles: Cluster time-series signatures to distinguish between crop types.
Such models enable phenological nowcasting , predicting growth phase transitions in near real time.
Toward Phenology Digital Twins
A Phenology Digital Twin integrates satellite NDVI, weather, and crop management data to simulate vegetation dynamics over time.
Capabilities include:
Forecasting vegetation cycles under climate scenarios.
Simulating irrigation or planting impacts on productivity.
Tracking ecosystem health and resilience in response to temperature anomalies.
Quantifying carbon assimilation over phenological stages.
For India, integrating such twins with agro-advisory systems can provide district-level, phenology-informed climate services , translating pixels into decisions.
Outlook: From Curves to Consequences
Phenology analytics move us beyond observation to intervention.
Every NDVI curve tells a story, of growth, stress, or resilience.
When combined with rainfall, temperature, and soil moisture data, these curves can shape real-world actions:
Crop advisories and harvest planning.
Early drought or pest alerts.
Carbon monitoring for reforestation and restoration projects.
Phenology isn’t just a satellite product, it’s nature’s operational dashboard.
Conclusion
The ability to read NDVI curves from space is the ability to read life itself.
From crops to forests, phenology is the living interface between climate and productivity.
And when mapped over time, it gives us the most valuable signal of all, how the Earth responds to change.