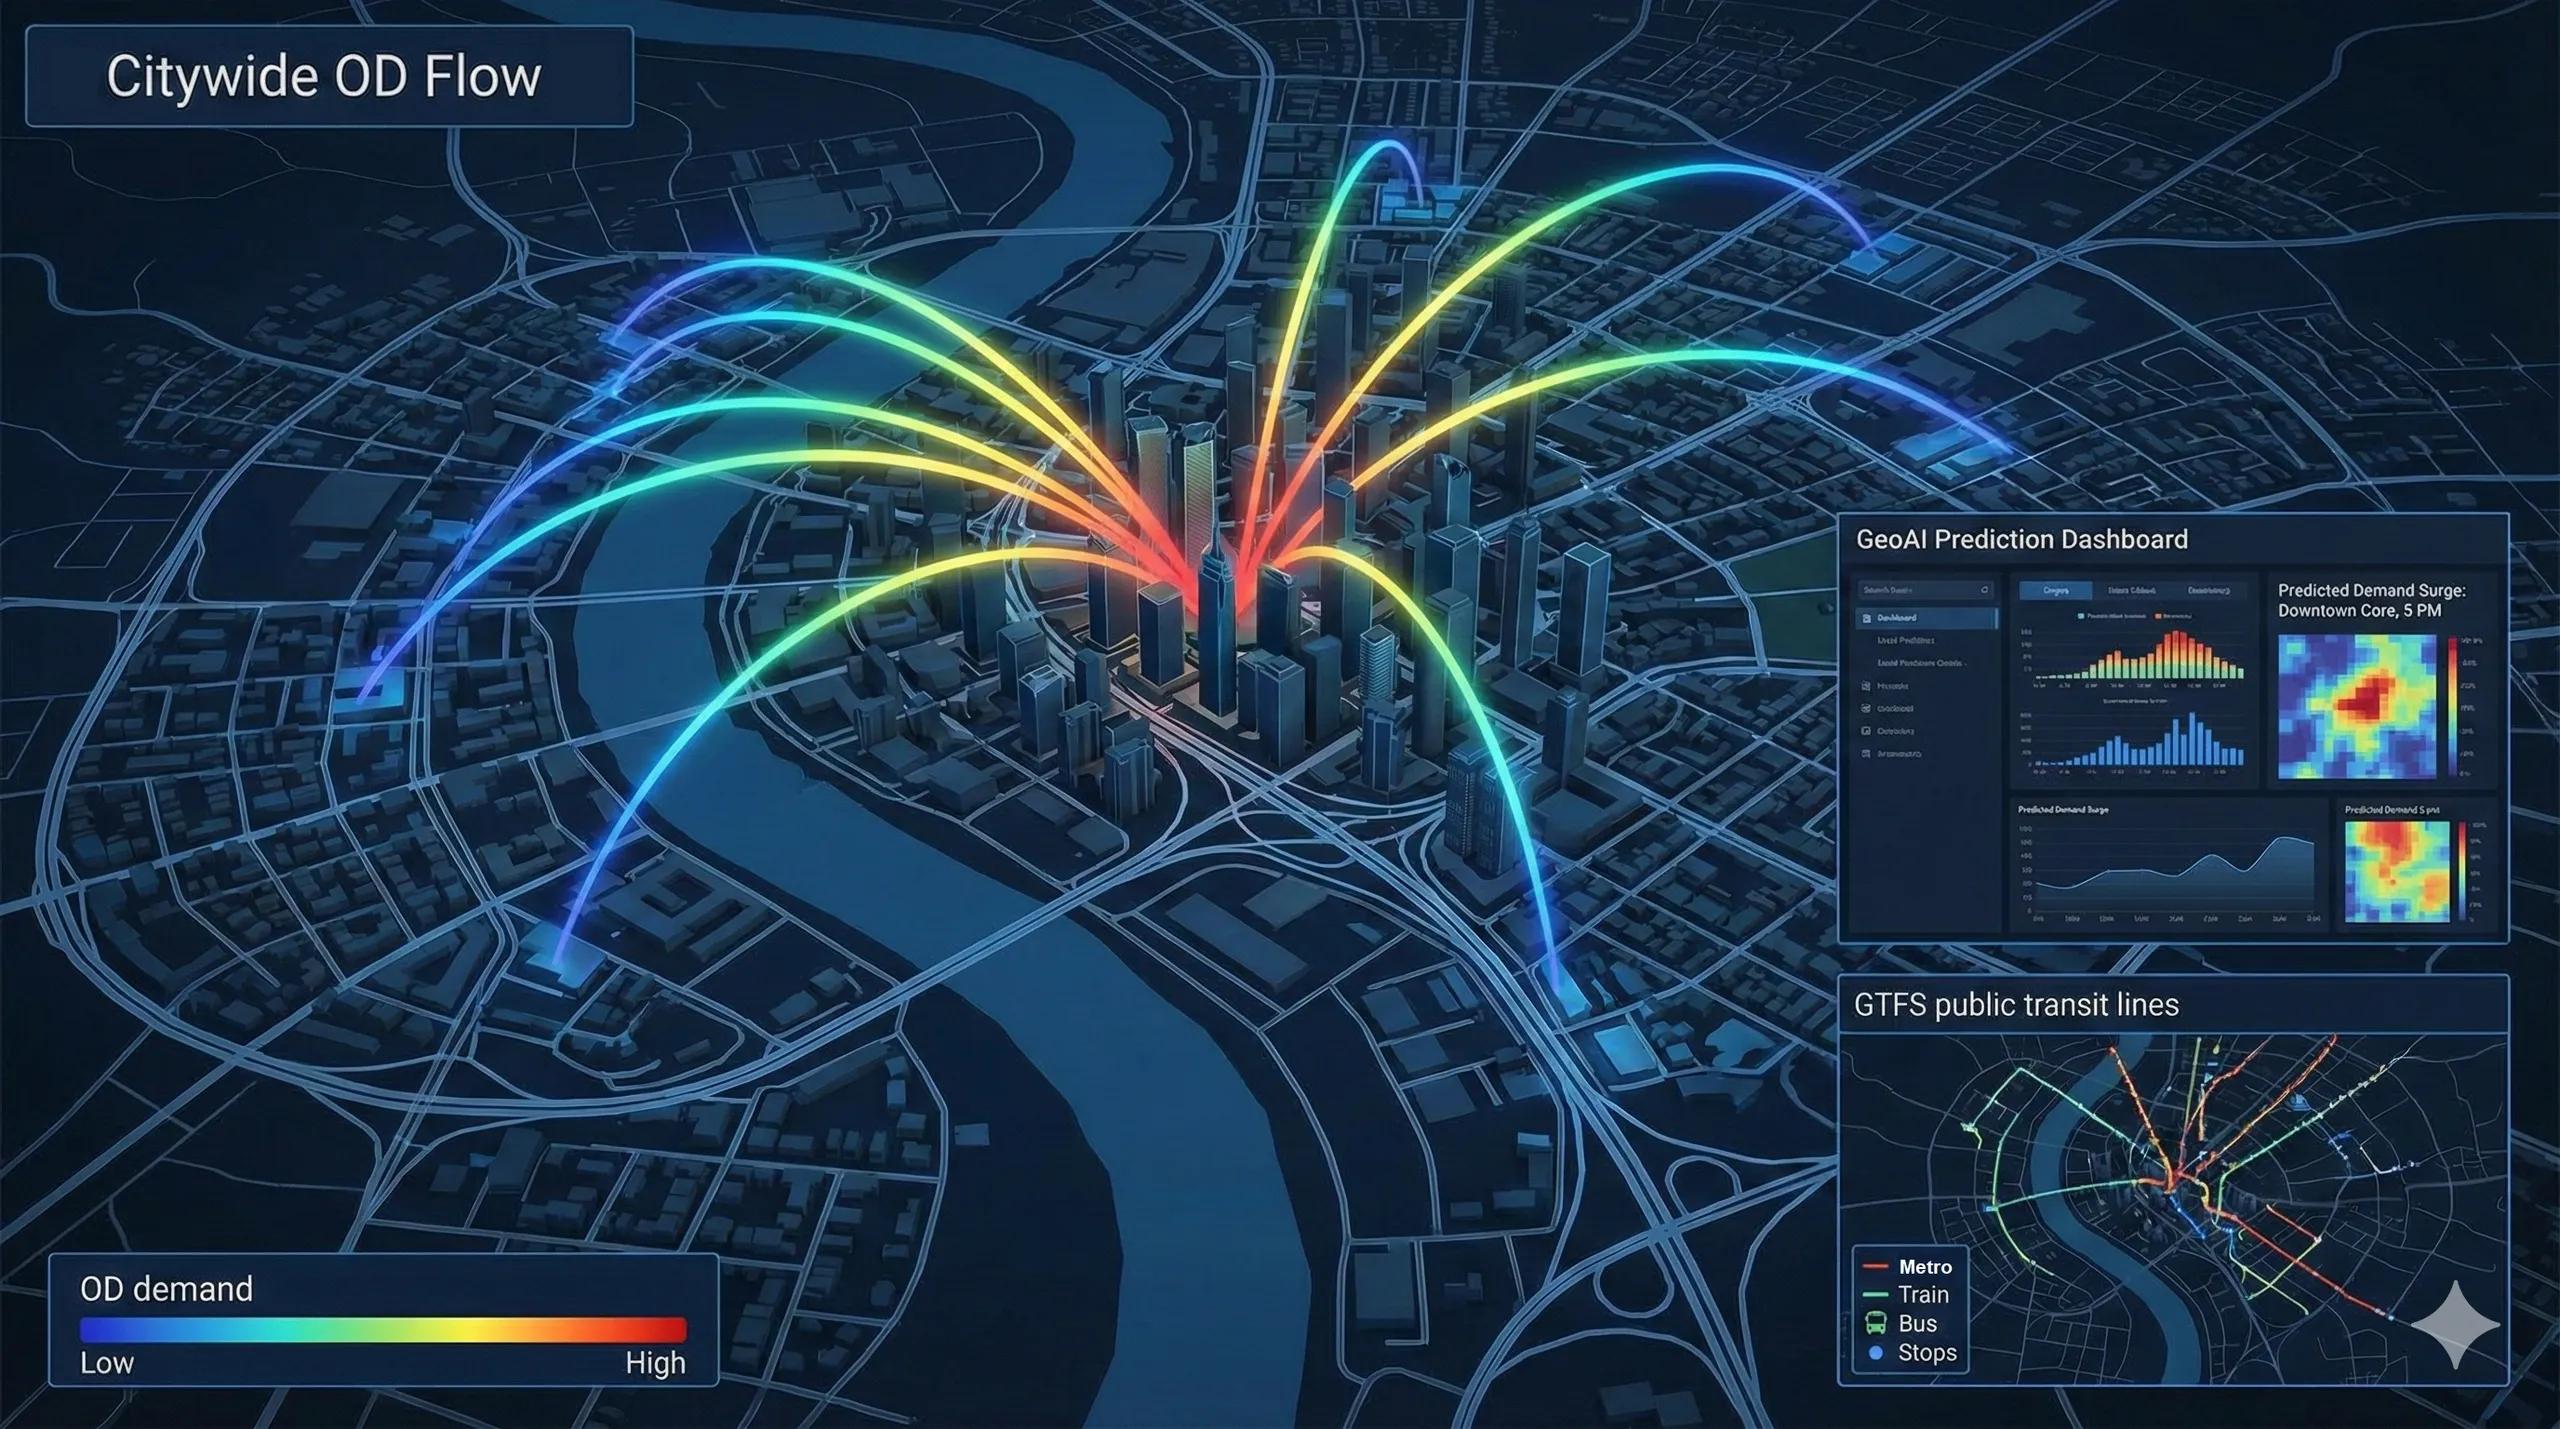
What if we could predict where every commuter in a city needs to go, before they start moving?
Mobility is not just buses, metros, autos, and roads.
It is flow , origin to destination, time to movement, demand to supply.
To understand urban flow, cities need two things:
GTFS (General Transit Feed Specification) , the structured, machine-readable blueprint of transit routes, stops, schedules, frequencies.
GeoAI , the intelligence layer that converts GTFS + city data into OD matrices, demand maps, and real-time mobility insights.
Together, these form the digital backbone for modern mobility planning and on-demand transit systems.
1️⃣ GTFS: The DNA of Public Transport
GTFS converts a city’s transit network into structured tables:
Routes
Trips
Stops
Stop Times
Frequencies
Shapes (geometries)
Calendar & exceptions
It transforms a transit agency’s human-readable schedules into a format that machines can simulate, analyze, and optimize .
For a geospatial analyst, GTFS is a goldmine for:
route coverage
first- and last-mile gaps
frequency heatmaps
service redundancy
temporal load patterns
accessibility scores
2️⃣ OD Matrices: The Skeleton of Urban Mobility
Origin–Destination (OD) matrices reveal how people actually move .
Inputs:
GTFS route geometry
Historical ridership
AFC (fare collection) data
Mobile network location traces
Ride-hailing trip logs
Smart-card tap-in/tap-out
Census & workplace distribution
GeoAI models transform this data into OD maps that show:
peak-hour flows
commute corridors
underserved regions
travel-time inequality
demand concentration nodes
multimodal interchange pressure
This allows planners to see demand instead of guessing it.
3️⃣ GeoAI: Turning Transit Data into Real Demand Intelligence
GeoAI enhances GTFS by learning patterns from:
time-of-day ridership
land use context
road congestion
weather events
event-based surges
seasonal trends
Models used:
LSTM for temporal demand forecasting
Graph Neural Networks for network flow
XGBoost for stop-level ridership prediction
Agent-based simulation for realistic movement
Spatial clustering (DBSCAN/HDBSCAN) for stop demand
Mode choice models using machine learning
Outputs include:
predicted OD matrices
stop importance ranking
optimal route design
frequency optimization
supply–demand mismatch detection
feeder network planning
4️⃣ GTFS + GeoAI for Indian Cities: Why It Matters
Indian cities show unique mobility signatures:
high modal mix
informal routes (autos, vans)
peak-direction congestion
short-distance commutes
narrow-road constraints
rapid land use change
GTFS alone cannot solve these.
GeoAI is the missing intelligence layer.
Examples:
In Hyderabad, GeoAI revealed 4 high-demand corridors missing from formal bus routes.
In Bengaluru, GNN models predicted metro feeder demand 40% more accurately than traditional models.
In Delhi, OD matrices highlighted that 22% of trips are <3 km, ideal for on-demand microtransit.
5️⃣ Demand-Responsive Transit (DRT), Built on GTFS Intelligence
DRT engines use:
GTFS (planned supply)
Real-time GPS (actual movement)
OD matrices (true demand)
GeoAI models (predictions)
Capabilities:
routing on demand
dynamic scheduling
fleet optimization
pickup–drop assignment
reducing dead mileage
increasing load factors
This is how cities transition from static bus routes → adaptive mobility networks .
6️⃣ Mobility Digital Twins
A Mobility Digital Twin integrates:
GTFS feeds
road network graphs
real-time GPS pings
demand forecasts
congestion patterns
multimodal transfers
policy scenarios
Cities can simulate:
new routes
frequency changes
metro expansion impacts
fare adjustments
BRT corridor performance
emergency evacuations
This is where GTFS becomes operational, not just informational.
Conclusion
GTFS provides the structure.
GeoAI provides the intelligence.
Together, they transform mobility from a reactive system into a predictive, adaptive, demand-responsive ecosystem .
Cities are networks.
Mobility is flow.
And GTFS + GeoAI is how we learn to read and shape that flow.