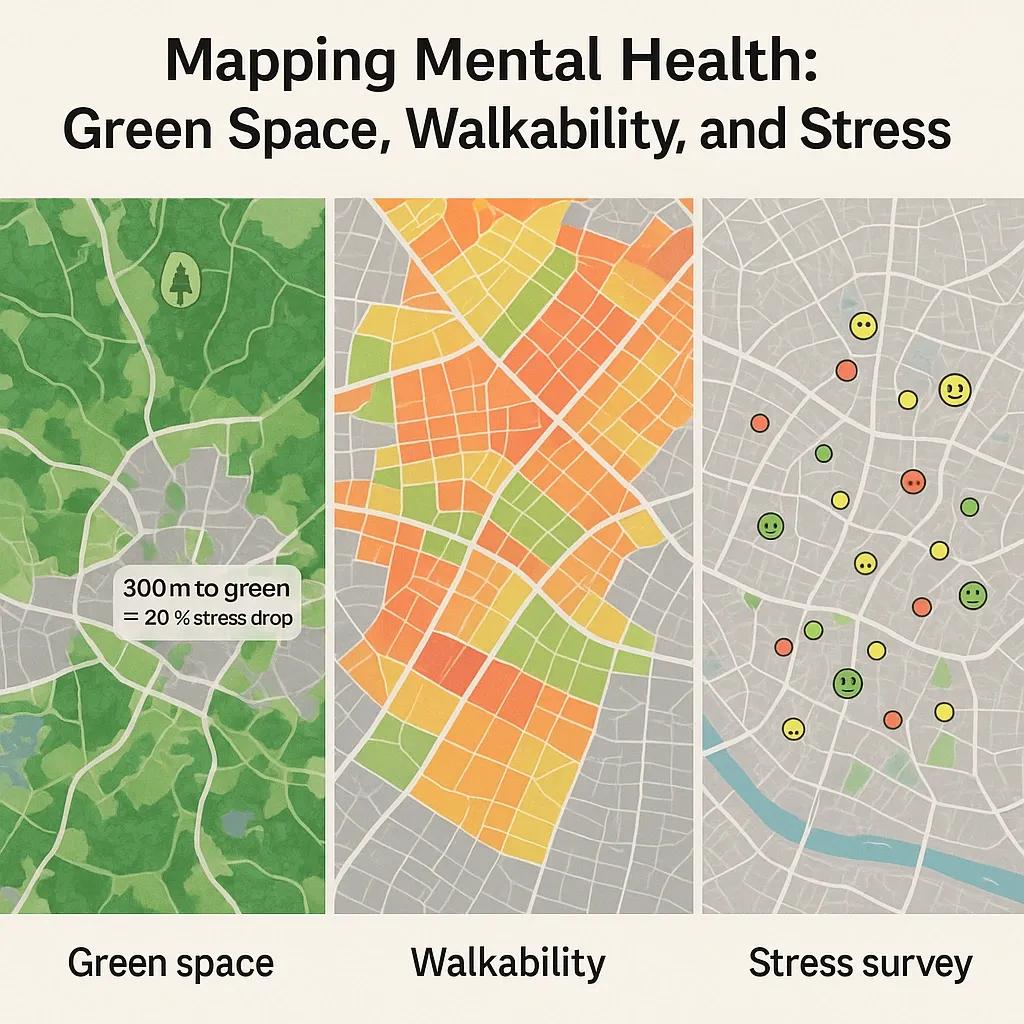
Urban design has traditionally prioritized economic efficiency, transport flow, and infrastructure development. However, in recent years, the focus has shifted toward human-centered planning, recognizing that mental health is a critical dimension of urban well-being. With growing evidence linking environmental factors to psychological outcomes, spatial data is now being used to explore how urban environments affect stress, anxiety, and depression levels. This article examines how spatial surveys are used to map mental health by analyzing correlations between green space, walkability, and stress in urban contexts.
Understanding the Urban-Mental Health Nexus
Urban environments are complex systems that shape behavior, movement, social interaction, and ultimately, mental health. Key environmental variables such as noise levels, crowding, exposure to nature, and access to amenities all contribute to psychological states.
According to the World Health Organization (WHO), urban living is associated with a 40% higher risk of depression and a 20% higher risk of anxiety compared to rural living. While these statistics are influenced by multiple socioeconomic factors, emerging research shows that spatial configurations of the built environment significantly mediate mental health outcomes.
Why Spatial Surveys Matter
Spatial surveys combine geospatial technology with psychology and public health to collect data about people's experiences in specific urban spaces. These surveys typically gather information through:
Geo-tagged questionnaires
Wearable sensors (e.g., heart rate variability, galvanic skin response)
Mobile app-based mood tracking
Location-based social media sentiment analysis
The resulting data is mapped using Geographic Information Systems (GIS) to visualize the distribution of stress levels, anxiety triggers, and areas of perceived safety or comfort across a city.
Key Environmental Variables and Their Mental Health Correlates
1. Green Space Access
The presence of urban green spaces, such as parks, tree-lined streets, and community gardens, has a well-established positive effect on mental well-being. Green space is associated with lower levels of stress, better mood regulation, and reduced symptoms of depression.
Spatial Indicators:
NDVI (Normalized Difference Vegetation Index) derived from satellite imagery
Proximity of residences to nearest park or green zone
Tree canopy density maps
Correlation Findings:
Individuals living within 300 meters of green space report significantly lower stress levels.
Spatial surveys in cities like Amsterdam and Singapore show higher self-reported mental health in neighborhoods with diverse and accessible vegetation types.
2. Walkability and Mobility
Walkable neighborhoods promote physical activity, social interaction, and reduced reliance on motor vehicles, all of which have secondary mental health benefits.
Spatial Indicators:
Walk Score® or similar composite indices
Density of pedestrian pathways, zebra crossings, and shaded walkways
Average block length and intersection density
Correlation Findings:
A 10-point increase in walkability score correlates with a 7% reduction in reported daily stress, based on survey data from Melbourne and Toronto.
Areas with high walkability also show higher "happiness heatmaps" from location-tagged social media posts.
3. Stress Hotspots
Urban stress can stem from various sources including noise, air pollution, and crowd density. Spatial surveys can pinpoint stress hotspots by combining environmental data with personal feedback.
Spatial Indicators:
Real-time air quality and noise monitoring data
Density of traffic congestion
Crime mapping and surveillance camera coverage
Correlation Findings:
In New York City, a study using wearable biometric devices showed elevated cortisol levels among pedestrians in areas with poor air quality and high noise pollution.
Stress mapping reveals clusters near transport terminals, commercial hubs, and industrial zones.
Technologies Powering Spatial Mental Health Analysis
a. GIS & Remote Sensing
These tools enable mapping of land use, vegetation cover, and urban form at multiple scales. GIS is used to overlay multiple data layers, green space, traffic patterns, socioeconomic demographics, to explore composite mental health impacts.
b. Mobile Sensing and Crowdsourcing
Mobile apps like Urban Mind and MapMyMood crowdsource emotional responses to specific places. These platforms ask users to log mood changes in real-time, providing highly localized and time-stamped emotional data.
c. Machine Learning for Pattern Detection
ML models trained on geospatial and mental health datasets can detect patterns and predict psychological stress zones. For instance, convolutional neural networks (CNNs) have been used to relate satellite images of urban greenness to depression prevalence in U.S. cities.
Urban Planning Implications
With spatial mental health data, urban planners can move beyond generic zoning and design interventions targeted at improving psychological well-being. Some key applications include:
Designing green corridors to reduce fragmentation of green spaces and create continuous zones of stress relief.
Implementing "15-minute city" principles , ensuring that essential services, parks, and public spaces are within walking distance.
Prioritizing pedestrian-centric design in mental health-sensitive zones, especially near hospitals, elderly care centers, and schools.
Noise-buffering structures such as green walls or sound-insulated public transport stations in known stress hotspots.
Challenges and Considerations
Despite its promise, mapping mental health through spatial surveys comes with challenges:
Data Privacy : Health and location data are highly sensitive, requiring robust anonymization and ethical safeguards.
Temporal Variability : Mental health states fluctuate over time, necessitating longitudinal studies rather than static maps.
Causal Inference Limitations : Spatial correlation does not imply causation. Confounding factors such as income or employment status must be controlled.
Digital Divide : App-based surveys may exclude low-income or elderly populations who are less tech-savvy or lack smartphones.
Case Study: Seoul, South Korea
In Seoul, researchers implemented a "Mental Map" project involving 1,200 participants. Participants used a mobile app to record emotional responses as they moved through the city. The spatial data was layered with air quality maps, land use, and green space indices. Findings revealed that micro-parks, small, dispersed green spaces, had a higher stress-reducing impact than large but distant parks. This insight is now being used to guide Seoul’s "100 Small Forests" initiative.
Conclusion
Mapping mental health through spatial surveys is a growing field that bridges urban planning, geospatial technology, and public health. By correlating green space, walkability, and stress, planners can identify psychological pain points and design more supportive environments. While challenges around data privacy and causality persist, the integration of spatial data into mental health policymaking holds great potential for building healthier cities.