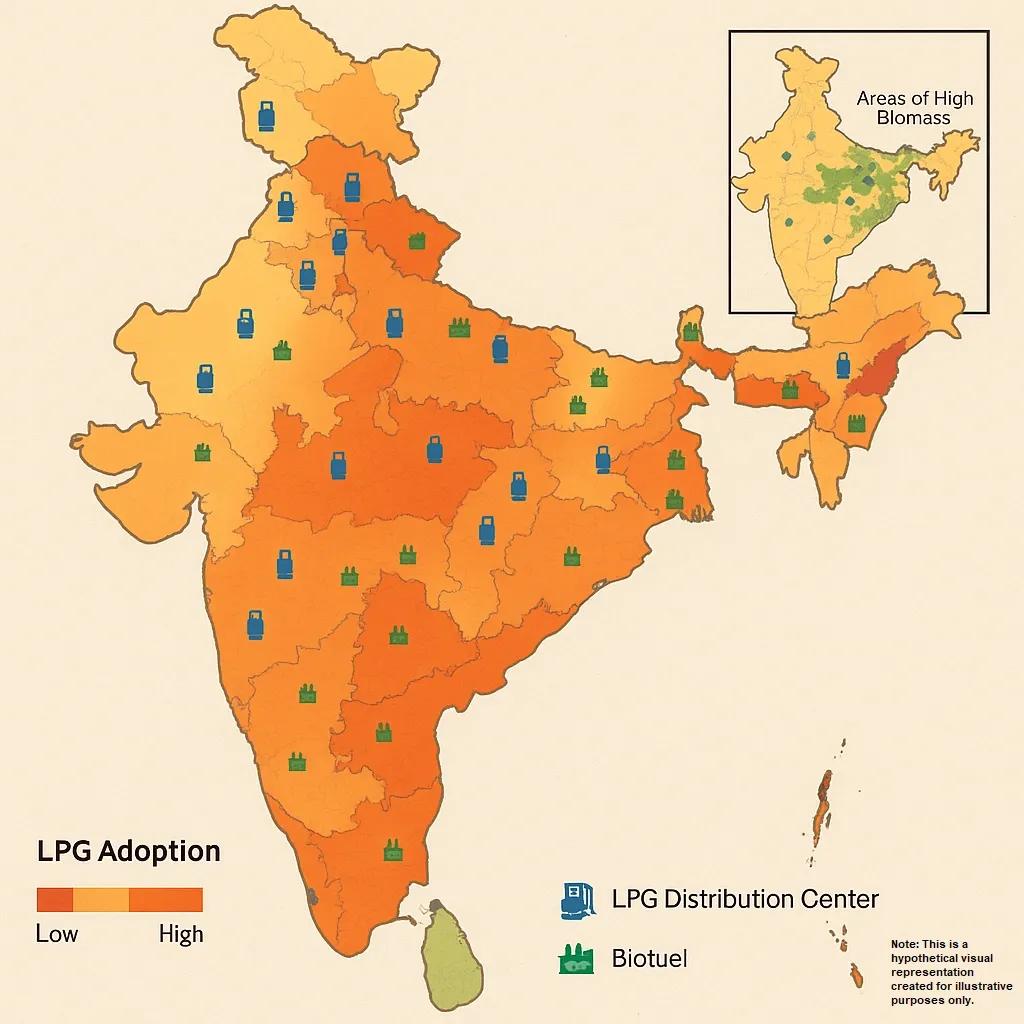
Access to clean cooking fuel is essential for public health, environmental sustainability, and social development. In many developing regions, especially in South Asia and Sub-Saharan Africa, millions still rely on biomass fuels like firewood, charcoal, and dung for cooking. These traditional fuels contribute to indoor air pollution, deforestation, and greenhouse gas emissions. To address this, national programs and global development agendas have promoted a transition toward cleaner alternatives such as Liquified Petroleum Gas (LPG), biogas, and ethanol-based fuels.
However, tracking this transition effectively remains a challenge due to limited ground-level data and the dynamic nature of fuel usage patterns. Here, geospatial technologies offer a powerful lens to map, monitor, and predict clean cooking fuel adoption trends. This article explores how spatial data and GIS (Geographic Information Systems) can be leveraged to support the clean energy transition, with a focus on LPG and biofuel usage.
The Context: Energy Poverty and Clean Cooking
Approximately 2.3 billion people still lack access to clean cooking fuels globally, according to the International Energy Agency (IEA). In India, for example, the Pradhan Mantri Ujjwala Yojana (PMUY) program has been instrumental in expanding LPG access to rural households. But access does not equate to consistent usage. Affordability, infrastructure, cultural habits, and seasonal variations affect adoption and sustained use.
Spatial data helps address this gap by offering a visual and analytical understanding of where adoption is happening, where it is lagging, and what factors are influencing these trends.
Role of Spatial Data in Mapping Fuel Transitions
Spatial data combines location-based information with attributes such as population density, infrastructure, income levels, and environmental indicators. When integrated with cooking fuel data, it enables comprehensive analyses that are not possible with tabular data alone. Here’s how:
1. Mapping Fuel Usage Patterns
Satellite imagery, remote sensing, and household surveys can be combined to identify patterns of fuel usage across geographies. For example:
LPG adoption maps can be generated using government data on cylinder distribution, retail network availability, and refill frequencies.
Biomass dependency hotspots can be visualized using vegetation index (NDVI) data, which indirectly indicates deforestation due to fuelwood collection.
These maps provide insights into areas with high clean fuel penetration and regions still reliant on traditional sources.
2. Infrastructure and Supply Chain Visibility
The availability of clean fuel depends on the supply chain infrastructure. Geospatial tools can help:
Map LPG bottling plants, storage depots, and distributor locations.
Use network analysis to identify underserved areas that are far from LPG distribution centers.
Monitor last-mile delivery performance using real-time GPS data of fuel trucks.
This kind of spatial logistics intelligence helps optimize fuel supply strategies and ensure equitable access.
3. Demand Forecasting and Policy Planning
Spatial datasets on population growth, income levels, and cooking habits can be combined to model future demand for clean fuels. Policymakers can use this for:
Scenario-based simulations to forecast LPG and biofuel needs.
Identifying priority districts for new infrastructure development or subsidies.
Evaluating the impact of climate and disaster risk on fuel supply continuity, such as floods disrupting delivery routes.
Data Sources for Spatial Analysis
To effectively map clean cooking transitions, data must come from diverse sources:
Household surveys : e.g., National Family Health Survey (NFHS), Demographic and Health Surveys (DHS), Census.
Government databases : e.g., PMUY data, LPG sales records, state energy department statistics.
Satellite imagery : for land use, vegetation cover, urban-rural classification.
OpenStreetMap (OSM) : for mapping road networks, retail shops, and urban features.
IoT sensors and mobile apps : for real-time tracking of cylinder usage and biofuel production units.
Combining these with GIS platforms (such as QGIS, ArcGIS, or cloud-based dashboards) enables detailed, scalable mapping efforts.
Case Example: India’s LPG Expansion and Geospatial Tracking
India offers a compelling example. Between 2016 and 2022, over 90 million LPG connections were issued under PMUY. But a follow-up analysis using spatial tools revealed disparities:
High adoption in some regions did not translate to high refill rates.
Rural and tribal belts showed seasonal reversion to firewood due to LPG cost.
Spatial correlation with forest proximity highlighted where biomass use persisted despite LPG access.
By layering refill data over satellite images and population clusters, researchers could pinpoint where usage needed support through awareness, subsidies, or infrastructure improvements.
Tracking Biofuel Adoption with Spatial Intelligence
While LPG is a centralized solution, biofuels (biogas, ethanol, pellet-based fuels) are more decentralized. Mapping their adoption involves:
Locating household- or community-level biogas plants using UAV imagery or government installation records.
Mapping feedstock availability, e.g., livestock population data for dung-based biogas, or crop residue maps for agri-waste.
Identifying areas with potential for waste-to-energy conversion through spatial overlays of solid waste data and power consumption.
GIS platforms can assess techno-economic feasibility at the micro-level, enabling targeted biofuel investments in rural clusters.
Spatial Analysis Techniques Applied
Several spatial analysis methods can be applied to clean cooking fuel mapping:
Technique - Purpose
Hotspot analysis - Identifies clusters of high or low LPG usage.
Proximity analysis - Measures distance from households to the nearest distributor or biofuel plant.
Suitability modeling - Combines environmental and demographic layers to identify ideal sites for clean fuel infrastructure.
Change detection - Tracks fuel adoption trends over time using satellite images and usage reports.
Network analysis - Optimizes LPG delivery routes and biofuel logistics based on road networks.
These techniques not only help understand the current state but also plan interventions.
Challenges in Spatial Mapping of Cooking Fuel Adoption
While geospatial tools offer powerful insights, several challenges remain:
Data availability and standardization : Household-level data is often scattered or outdated.
Granularity : Many datasets are at the district level, which may miss local variations.
Dynamic usage patterns : Households may use multiple fuels (stacking), making it hard to label them as ‘clean’ or ‘unclean’ users.
Behavioral factors : Cultural preferences and gender roles, not easily quantifiable, influence adoption.
Addressing these requires combining spatial data with socio-economic surveys and qualitative fieldwork.
The Road Ahead: Integrating GIS with AI and Mobile Platforms
The next frontier is integrating spatial data with AI/ML algorithms for predictive analytics:
Machine learning models can identify non-obvious predictors of clean fuel adoption.
Mobile-based crowd-sourcing apps can gather real-time data from users about fuel use, refill challenges, or price tracking.
GeoAI platforms can analyze satellite imagery to detect changes in cooking-related smoke emissions or deforestation over time.
Governments and organizations should also promote open data policies and encourage public-private collaboration to improve geospatial data sharing.
Conclusion
Clean cooking fuel adoption is not just an infrastructure problem, it is a spatial problem. Using GIS and spatial data science, we can trace fuel usage patterns, identify underserved regions, optimize supply chains, and support evidence-based policymaking. As India and other countries push toward universal access to clean energy under SDG 7, mapping LPG and biofuel transitions with geospatial intelligence will be a cornerstone of sustainable energy planning.