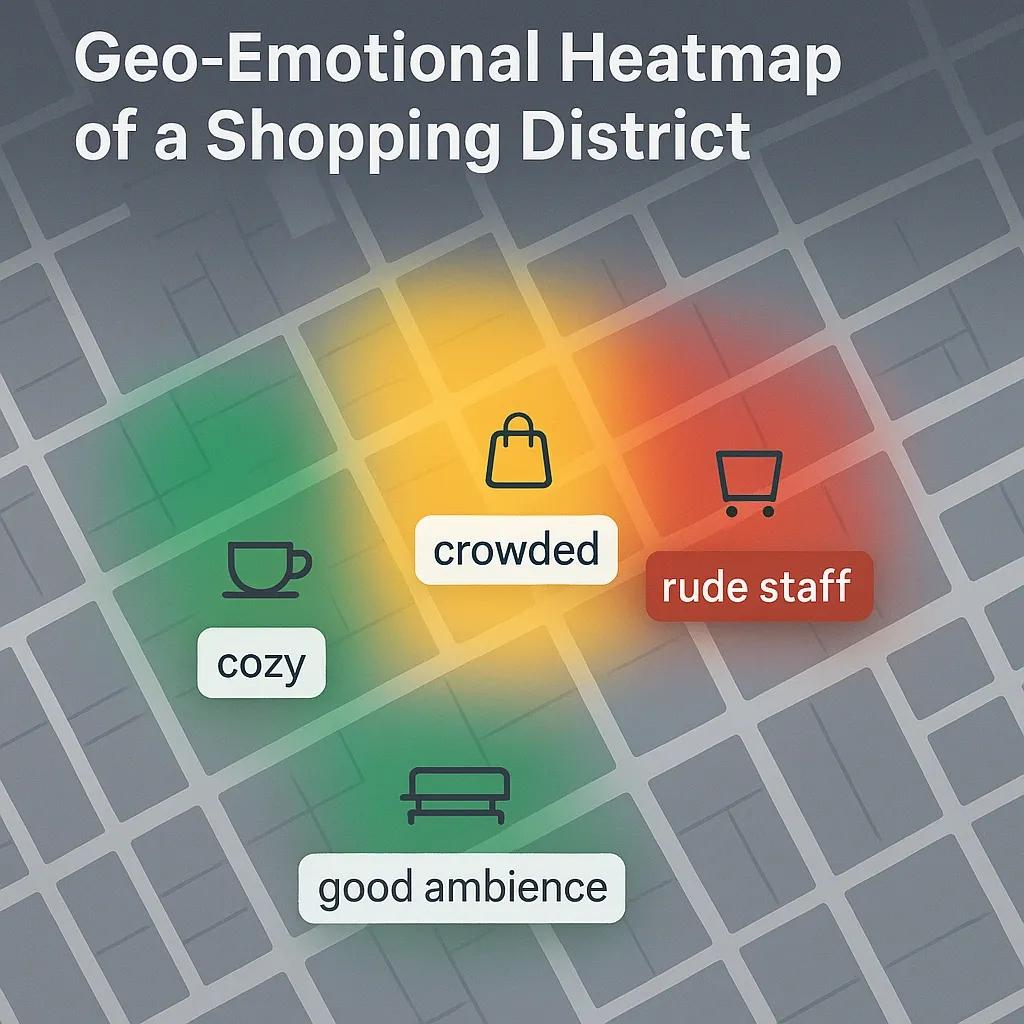
In today’s competitive retail environment, success is no longer driven solely by location, pricing, or product quality. Emotional engagement and customer experience now play a critical role in brand perception and consumer loyalty. One emerging technique in this space is Location-Based Sentiment Analysis (LBSA), an approach that combines geospatial intelligence with natural language processing (NLP) to map public sentiment tied to specific locations such as retail stores, malls, streets, or public plazas.
By analyzing geo-tagged textual data from social media, customer reviews, and surveys, businesses can now quantify emotional responses at a spatial level. This offers a strategic layer of insight into how different locations are perceived emotionally and what aspects of customer experience drive footfall, dwell time, or avoidance. This article explores the methodology, data sources, applications, challenges, and future directions of LBSA in retail strategy.
1. What Is Location-Based Sentiment Analysis?
Location-Based Sentiment Analysis is the practice of using geotagged data to associate emotional sentiment with specific physical locations. This involves:
Extracting text-based data with spatial metadata (e.g., tweets, Instagram captions, Google reviews)
Applying NLP techniques to classify sentiment (positive, neutral, negative) and emotions (joy, anger, sadness, etc.)
Mapping this sentiment across a spatial grid or against point-of-interest (POI) datasets such as retail stores or shopping districts.
This spatial sentiment mapping enables granular emotional profiling of consumer touchpoints, allowing businesses to refine operational, marketing, and spatial strategies.
2. Data Sources for LBSA in Retail
Key data inputs for location-based sentiment analysis include:
Source - Examples - Sentiment Potential
Social Media - Twitter, Instagram, TikTok - Real-time, informal emotional expressions
Review Platforms - Google Maps, Yelp, Zomato - Structured feedback with location & rating
Customer Feedback Forms - In-app surveys, NPS responses - Rich insights post-interaction
Footfall & Location Data - Wi-Fi logs, mobile GPS, beacon data - Behavioral validation of sentiment trends
Voice or Chat Logs - IVR transcripts, chatbots - Emotion-rich narratives, linked to service events
Each source has its own signal-to-noise ratio, frequency, and reliability, making data fusion and preprocessing essential to build a coherent sentiment landscape.
3. Methodology: From Raw Text to Spatial Insights
The LBSA workflow consists of the following steps:
A. Data Collection and Cleaning
Collect text entries with spatial metadata (geotags, POI IDs, or location mentions).
Remove noise, filter non-relevant posts, spam, or bot-generated content.
Normalize text to handle slang, typos, or multilingual expressions.
B. Sentiment Classification
Use NLP models like VADER, TextBlob, or transformers like BERT to classify text into: Polarity : Positive / Neutral / Negative Emotion classes : Joy, Anger, Disgust, Surprise, Sadness, etc.
C. Geospatial Tagging and Mapping
Match each sentiment entry to a precise spatial unit: store ID, ZIP code, or grid tile.
Use geospatial libraries (e.g., GeoPandas, PostGIS) to overlay sentiment layers on urban or retail maps.
D. Temporal and Spatial Aggregation
Aggregate sentiment over time (hourly, daily, seasonal) and space (per POI, per floor, per city block).
Identify hotspots (areas with dominant positive or negative sentiment) and change zones (areas where sentiment is shifting over time).
4. Applications in Retail Strategy
A. Store Performance Diagnostics
By mapping sentiment against store locations, brands can detect underperforming outlets, not based on sales but on how they’re emotionally perceived. Negative sentiment tied to service delays, cleanliness, or staff behavior can be flagged for corrective action.
B. Competitor Benchmarking
Retailers can compare sentiment around their own stores with nearby competitors. For instance, a store may lose footfall despite better pricing if nearby competitor outlets have stronger positive sentiment tied to ambience or staff friendliness.
C. Hyperlocal Marketing
Location-based sentiment maps help marketers tailor promotions. A mall zone with consistent “crowded” and “slow service” tags might need an operational fix before marketing a new launch there.
D. Store Design & Urban Planning
Urban developers and mall operators can use aggregated public sentiment to redesign underwhelming spaces. If an area consistently evokes emotions like "confusing layout" or "unsafe at night," spatial redesign becomes a priority.
E. Predicting Footfall and Conversion
Sentiment can be used as a predictor for physical traffic, complementing traditional metrics like weather or proximity. Stores with highly positive sentiment often see higher conversion rates even with moderate traffic.
5. Challenges in Implementation
Challenge - Description
Data Bias - Geotagged content is not uniformly distributed, urban and younger demographics are overrepresented.
Ambiguity in Language - Sarcasm, local dialects, and idioms may confuse sentiment algorithms.
Privacy Compliance - Geospatial data tied to user identity needs to comply with GDPR, India's Digital Personal Data Protection Bill, and similar laws.
Spatial Resolution - Some posts are tagged to cities or regions, not exact stores, reducing precision.
Real-time Integration - Continuously analyzing and updating sentiment maps requires scalable cloud infrastructure.
These issues demand robust data governance, model training on localized data, and careful UX design for internal use.
6. Future Directions
A. Multimodal Sentiment Analysis
Incorporating image and video content (e.g., Instagram stories, TikTok reviews) for sentiment extraction via computer vision.
B. Indoor Sentiment Mapping
Using Wi-Fi-based positioning and in-store app check-ins to map sentiment at the aisle or shelf level, ideal for supermarkets or large-format retail.
C. Predictive Sentiment Modeling
Integrating LBSA into digital twin models of retail spaces to simulate emotional responses to changes in layout, signage, or lighting.
D. Sentiment-Driven Personalization
Tuning in-store experiences based on known location-linked emotional feedback, for example, adjusting music or lighting based on dominant sentiment.
Conclusion
Location-Based Sentiment Analysis is transforming how retail strategists understand and shape the customer journey. By going beyond conventional metrics and mapping emotional reactions across geographies, businesses can gain actionable insights into what customers truly feel in different spaces. With proper data handling, scalable tools, and targeted actions, LBSA has the potential to drive smarter retail decisions, right from store-level fixes to citywide branding strategies.