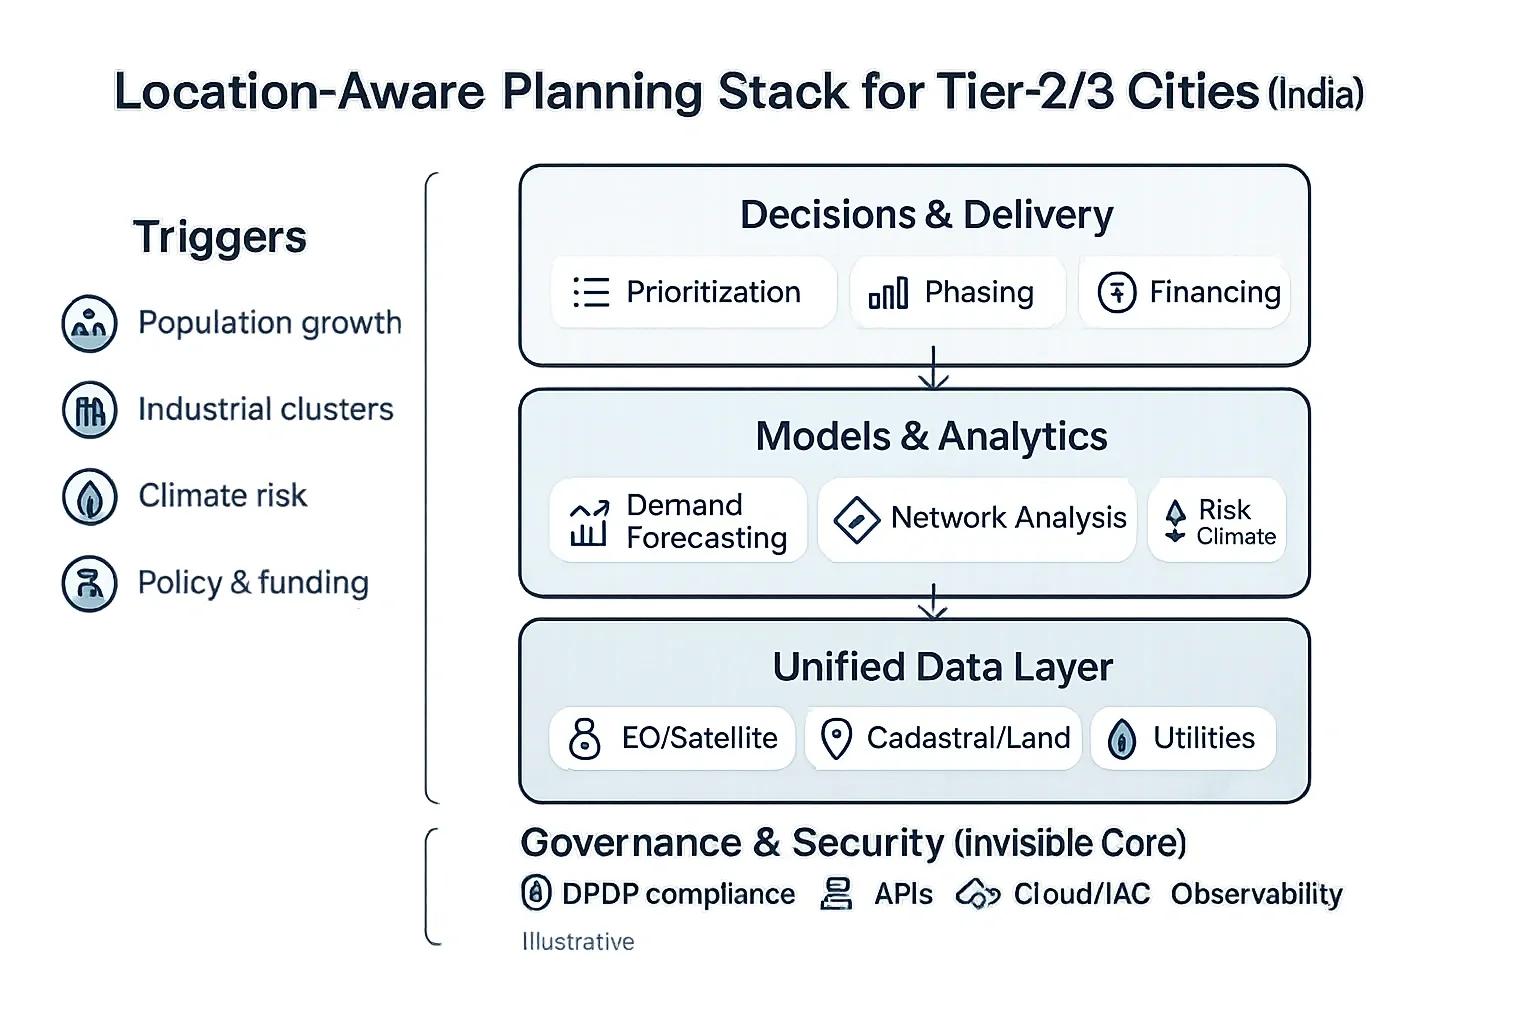
Tier-2/3 cities are absorbing rapid growth driven by new industries, affordable housing, and migration. Yet plans often rely on averages, not actual location intelligence. Location-aware infrastructure and planning uses geospatial data, digital twins, and demand models to direct every rupee to the street, ward, and parcel where it matters most, accelerating service coverage and reducing lifecycle costs.
Why it matters now (India context)
Urban expansion is shifting to non-metro cities where baseline networks (pipelines, drains, transit) are still forming.
Land is fragmented, data is siloed, and execution depends on many agencies. Without a shared map and model, projects slip and budgets leak.
The Digital Personal Data Protection (DPDP) Act and open-data push enable secure, standards-based data sharing across agencies, an ideal moment to institutionalize location-aware planning.
Problem → Solution
Core challenges
Blind spots: Ward-level population and mobility patterns change faster than master plans.
Capex bias: Big projects get funded; small but high-ROI fixes (last-mile pipes, bus shelters, junction redesign) wait.
Execution friction: Multiple utilities dig the same road due to missing cross-agency coordination.
Climate risk: Stormwater and heat stress aren’t embedded in siting and phasing.
Location-aware approach
Unified Data Layer (city digital base map) Satellite/EO tiles, cadastral parcels, building footprints Utilities (water, sewer, power), road inventory, transit routes Mobility (traffic counts, GTFS), IoT sensors, socio-economic data Governance: DPDP compliance, access controls, APIs
Models & Analytics Demand forecasting: population + land-use + points of interest Network analysis: pressure zones, pipe criticality, bus catchments Suitability & risk: flood/heat overlays for site selection Cost-to-serve & ROI: what to build first for maximum gain
Decisions & Delivery Prioritized works program (quarterly) with ward-level outcomes “No-dig conflicts” registry across utilities M&E dashboards tracking service coverage, time-to-benefit, and unit costs.
Minimal viable stack (6–9 months)
Month 0–1: Discover & Baseline , compile open/agency datasets, clean geometry/topology, define data contracts.
Month 2–3: City Digital Twin L1 , layers for parcels, utilities, mobility, drains; basic demand and risk surfaces.
Month 4–6: Priority Engine , automated shortlists for water fixes, bus stop siting, junction upgrades; clash-free works calendar.
Month 7–9: Scale & Sustain , API integrations (permits, payments, project systems), quarterly refresh, on-ground validation loops.
“Would your city benefit more from early wins in water reliability or bus network frequency?”
Use case: A fast-growing tier-2 cluster
A 1–1.5 million population city zones a new industrial belt and two housing townships. Pain points: summer water stress, bus crowding at peak hours, and frequent road cuts.
What the twin reveals
Micro-areas with poor pipe looping and low pressure; quick fixes (valves, 1.5 km infill line) stabilize supply.
High-demand bus corridors have stop spacing >700 m; adding 18 stops reduces average walk time by ~35% (illustrative).
A 6-month no-dig calendar prevents sewer, and fiber works from overlapping road resurfacing, saving rework.
How decisions improve
Water: Pipe right-sizing + DMA balancing cut NRW and stabilize pressure for 20k+ households before next summer.
Mobility: Re-timed signals and properly spaced bus stops boost throughput without new flyovers.
Permitting: Geo-fenced permits ensure utilities follow an approved sequence; penalties auto-trigger on clashes.
Climate: All projects screened for flood/heat risk before DPRs are locked.
Benefits & ROI (typical ranges)
Capex efficiency: 10–20% savings by sequencing high-impact, low-cost works first.
Time-to-benefit: Early wins in 90–120 days (pressure stabilization, bus stop upgrades).
Less rework: 25–40% reduction in avoidable road cuts through cross-utility coordination.
Service equity: Transparent ward-level coverage KPIs build trust with citizens and councils.
Governance and standards
DPDP-first data governance : role-based access, consent for personal data, and audit trails.
Open standards : GeoPackage/GeoJSON, WMS/WFS, GTFS/MDS for mobility, OGC APIs for interoperability.
Procurement : outcomes over assets, pay on delivered service KPIs (pressure stability, headway adherence).
Conclusion
Tier-2/3 cities don’t need mega-projects to show progress. They need maps that think , unified data, simple demand/risk models, and a clear quarterly works program. Start with the next 90 days, prove the gains, and scale. The result: faster, fairer urbanization for India’s next 100 cities.
Note: Graphics are illustrative to explain concepts, not real city results.