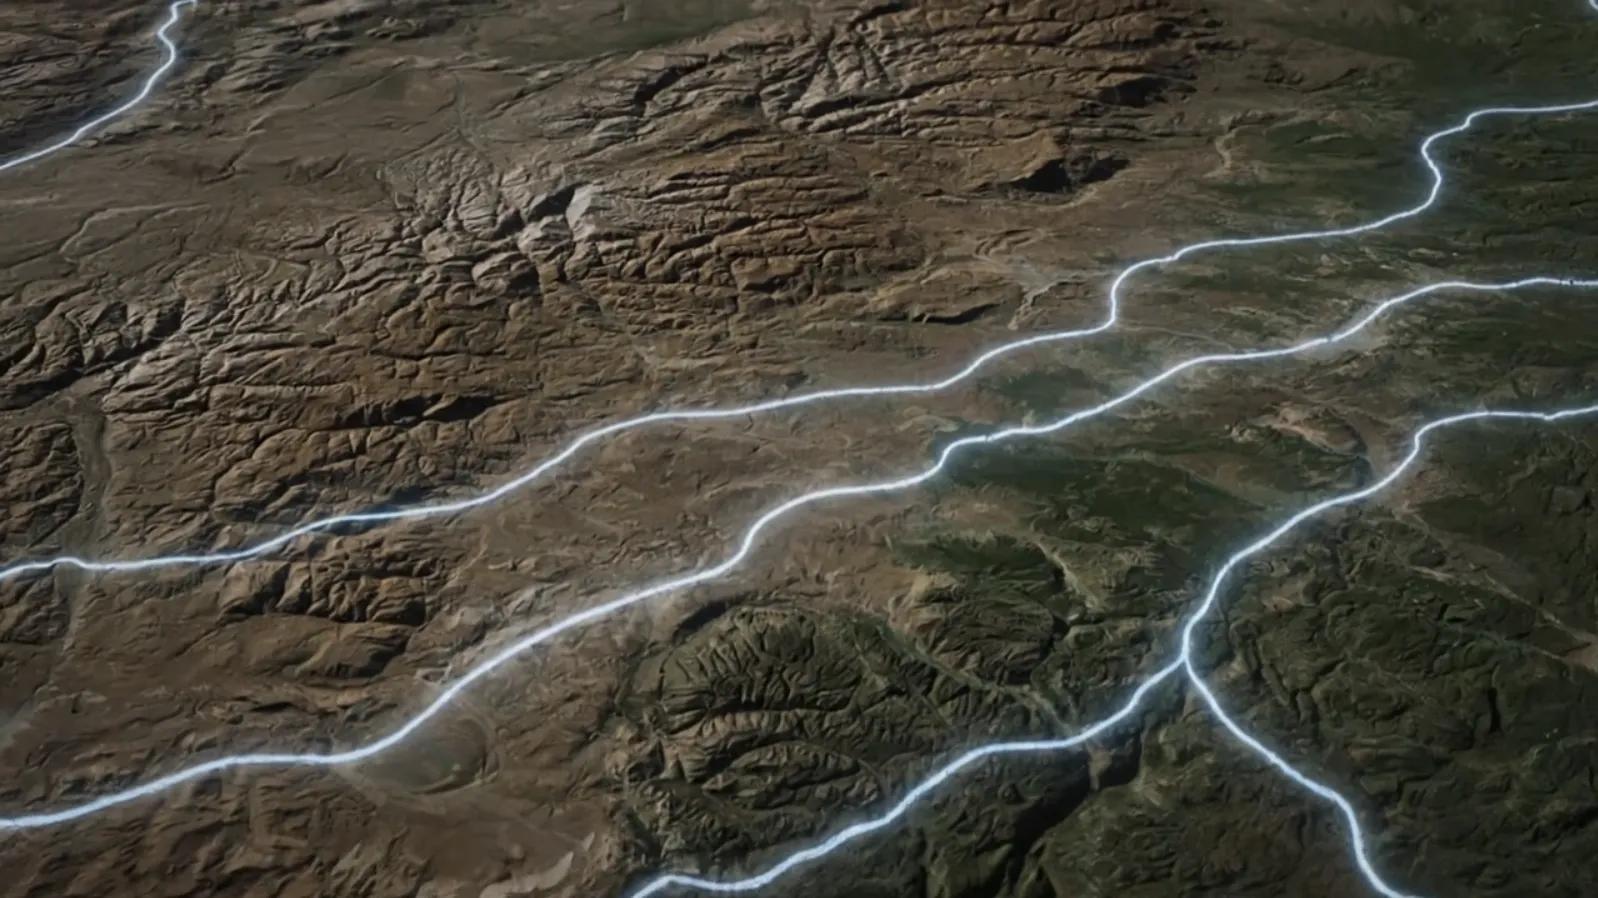
Reading the Crust’s Fracture Language
Beneath every landscape lies a hidden code, a network of fractures, faults, and linear alignments that guides how water moves, how minerals accumulate, and where stress builds up in the crust. These invisible cracks, called lineaments , are nature’s spatial indicators of subsurface structure.
Remote sensing and GIS have turned lineament analysis into one of the most powerful tools for groundwater prospecting, mineral targeting, and tectonic interpretation. In geospatial terms, lineaments act as natural connectivity vectors , revealing how the lithosphere breathes and evolves.
Decoding Lineaments: Nature’s Structural Signatures
A lineament is a linear or curvilinear feature on the Earth’s surface that reflects an underlying geological structure, such as a fault, fracture, joint, or lithologic contact. These patterns emerge in satellite imagery through tonal contrasts, drainage alignments, vegetation changes, or linear valleys.
Lineaments are categorized as:
Major (regional) lineaments: Large-scale tectonic faults or shear zones (tens to hundreds of kilometers).
Minor (local) lineaments: Fractures, joints, and fault splays influencing groundwater or mineral deposition at smaller scales.
Their spatial density and orientation provide vital clues about subsurface permeability, stress regimes, and resource potential.
Digitizing the Invisible: Remote Sensing and GIS Methods
Remote sensing has revolutionized how lineaments are identified, quantified, and modeled. The process typically involves four stages:
Preprocessing: Use DEMs or high-resolution imagery (Landsat 9, Sentinel-2, ASTER, CartoDEM) to enhance linear features.
Enhancement Techniques: Edge Detection Filters: Sobel, Canny, Laplacian filters in ENVI or QGIS. Principal Component Analysis (PCA): Highlights directional contrasts. Hillshade & Multi-Azimuth Illumination: Reveals terrain lineations in varying light angles.
Automated or Manual Extraction: Semi-automated extraction from filtered images. Manual tracing using hillshade composites for geological validation.
Vectorization and Analysis: Convert raster lineaments to vector polylines. Analyze orientation (rose diagrams), length density, and intersections.
This workflow translates visual alignments into quantitative spatial features , ready for statistical and predictive modeling.
Amplifying Understanding: Lineaments in Groundwater and Mineral Exploration
1. Groundwater Prospection
Fractures enhance secondary porosity and permeability, critical in hard rock terrains like peninsular India. Lineament density maps derived from remote sensing can pinpoint recharge zones, borewell sites, and aquifer corridors.
High lineament density = higher groundwater potential.
Intersections of lineaments = preferred drilling sites. GIS overlay of lineament density, lithology, slope, and land use helps delineate groundwater prospect zones.
2. Mineral Targeting
Lineaments often act as conduits for hydrothermal fluids , leading to ore deposition. Remote sensing–based lineament mapping combined with geochemical and magnetic data identifies mineralized belts. Examples:
Gold mineralization zones along shear lineaments in Karnataka.
Bauxite and iron ore alignment with fault-controlled ridges in Jharkhand and Odisha.
Uranium occurrences along NE–SW fracture trends in Rajasthan and Telangana.
3. Tectonic and Seismic Interpretation
Regional lineament trends (NW–SE, NE–SW) help delineate active faults and potential seismic zones, integrating satellite imagery with InSAR deformation data.
Case Example: Telangana Hard Rock Region, India
In the crystalline terrain of Telangana, groundwater is stored mainly in fractured rocks. Researchers used Landsat 8 OLI imagery and SRTM DEM to extract lineaments using directional filtering (N–S, NE–SW, NW–SE).
A lineament density map was produced in GIS by overlaying extracted features.
Validation through borehole yield data confirmed higher water availability in zones of dense lineaments (>2.5 km/km²).
The resulting model guided new borewell placements, improving drilling success rates by up to 40% .
This case demonstrates how remote sensing transforms fracture geometry into actionable hydrogeological intelligence.
GeoAI and Automated Lineament Detection
AI-driven image analysis now enables fully automated lineament extraction and classification:
Deep Learning (CNN-based) models trained on multi-spectral imagery can detect subtle geological lineations that evade human interpretation.
Tensor-based Edge Fusion: Integrates topographic and spectral cues to enhance weak lineaments.
Orientation Clustering Algorithms: Group extracted lineaments by directional trends to infer tectonic stress regimes.
Such models reduce manual bias and scale easily across large regional datasets, making AI-assisted structural mapping a key enabler of next-generation exploration.
Outlook: Integrating Subsurface and Surface Connectivity
Future digital twin models will integrate lineaments with hydrogeological flow networks, seismic fault maps, and mineral potential layers. By merging surface and subsurface datasets, scientists can simulate how fractures evolve, transport fluids, and influence landscape development.
Imagine a 4D geospatial model that not only visualizes fracture density but also predicts how a fault might migrate or how groundwater flow re-routes after seismic stress. That’s where geospatial science is heading, toward living fracture networks that continuously update through satellite and IoT data.
Conclusion
Lineaments are Earth’s connective tissue, the subtle lines that shape its structure, resources, and resilience. Remote sensing has given us the tools to map, quantify, and model these features with unprecedented precision.
By decoding these linear fingerprints, we gain insight into how water moves, where minerals form, and how the planet continues to reshape itself, quietly, yet constantly.