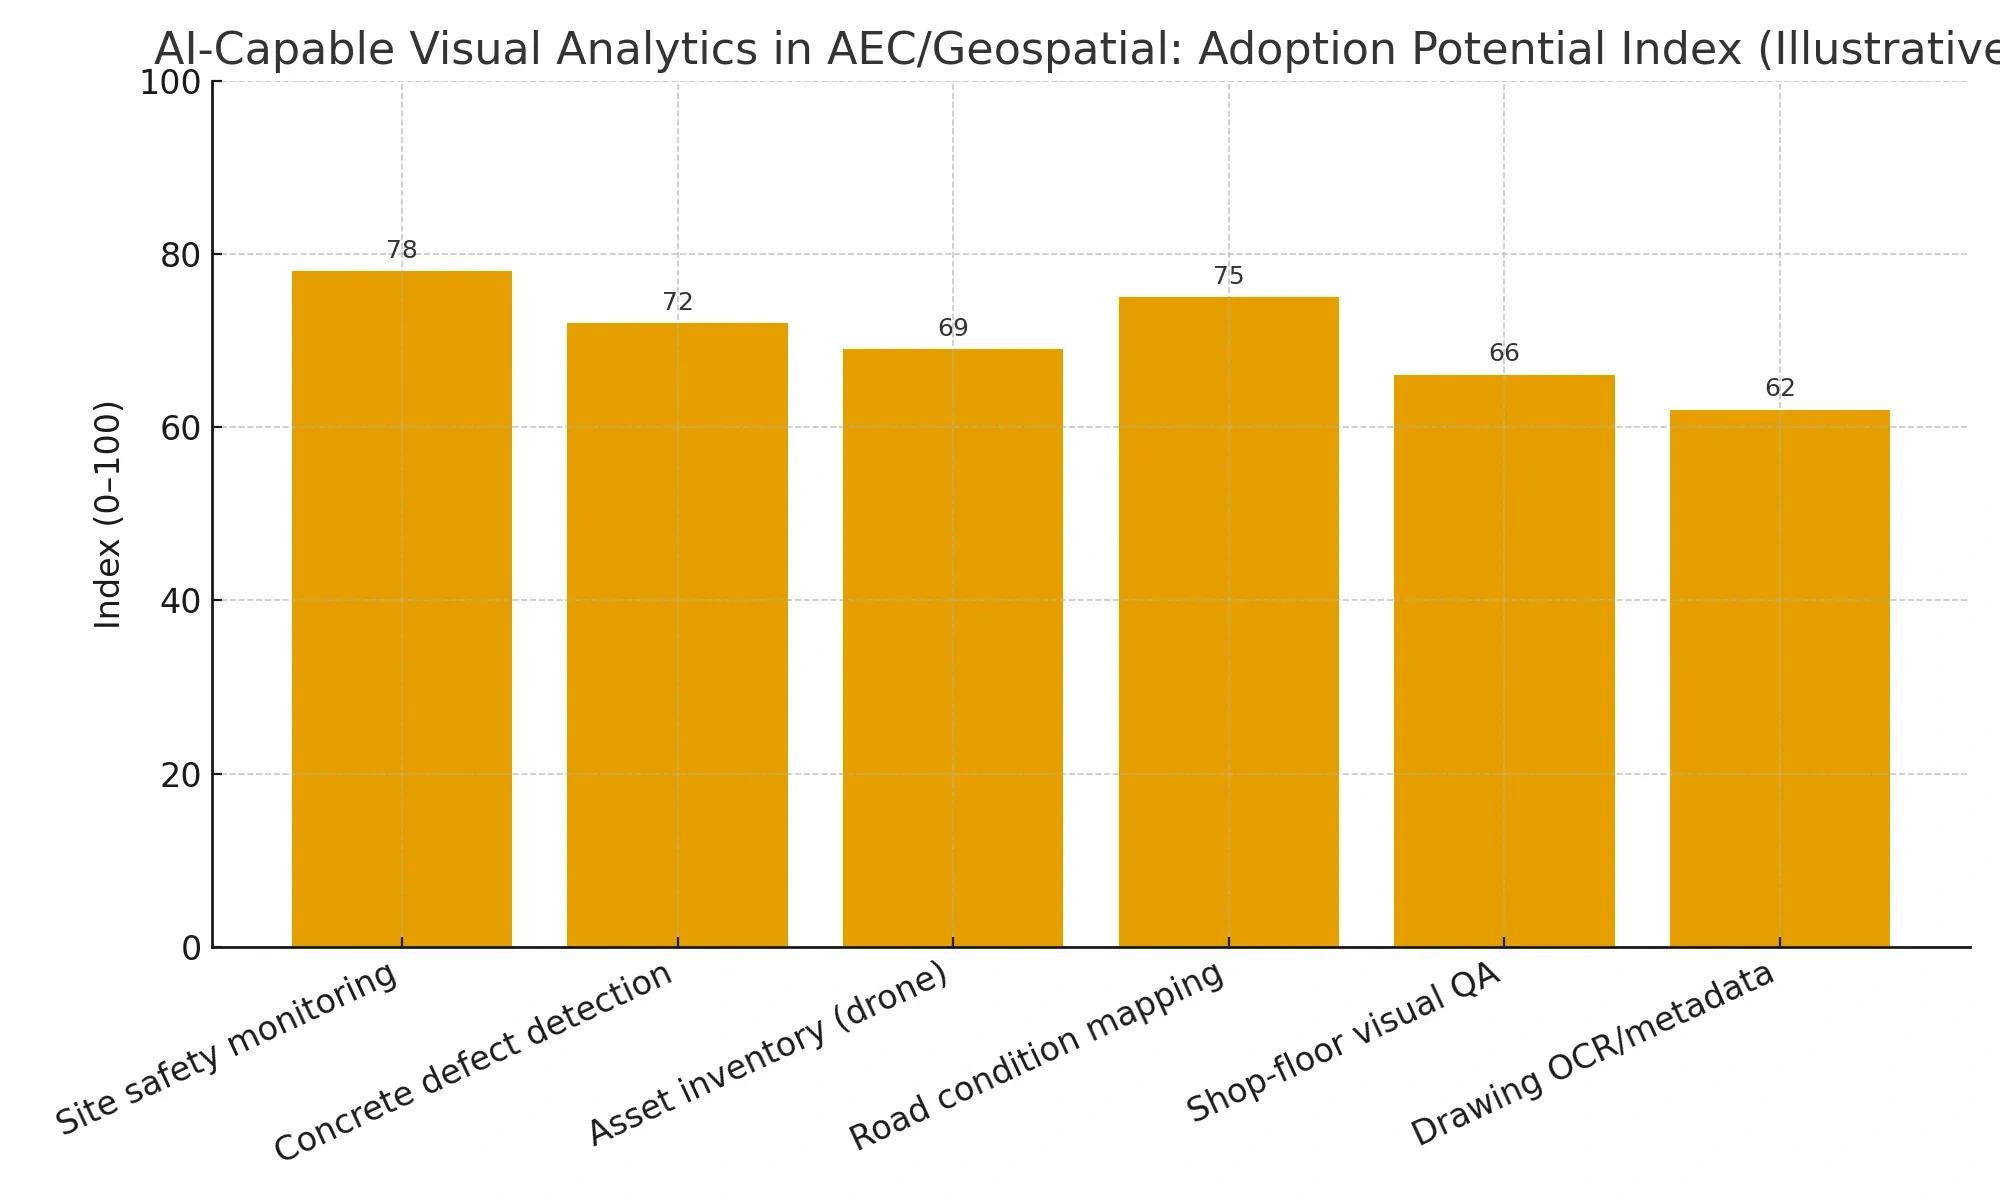
Computer vision (CV) is moving from demos to deployed systems across AEC, infrastructure, and manufacturing. Indian market demand is rising: low-cost cameras, UAVs, edge devices, and cloud AI make visual analytics practical at scale. For geospatial and BIM teams, CV is the fastest path to automate inspections, cut rework, and compress project timelines.
1. The opportunity
From images to actions: Convert photos, videos, drone orthomosaics, point clouds, and site scans into detections, measurements, and tickets.
Close the loop: Tie detections back to geospatial context (GIS features) and BIM elements (IFC/LOD) so the insight is actionable, who owns the fix, where, and by when.
Scale with the stack you have: Use commodity IP cameras, mobile phones, UAVs, and existing CDEs (ProjectWise/ACC/SharePoint) with lightweight model hosting.
2. High-impact use cases (Geo + BIM)
Site safety monitoring: PPE detection, unsafe proximity, barrier breaches.
Concrete quality & progress: Honeycombing, cracks/spalls, curing checks, and pour progress from time-lapse and drone imagery.
Road & asset condition: Potholes, rutting, lane-marking visibility, signage inventory using dash-cams/UAVs.
Shop-floor visual QA: Part presence/position, surface defects, assembly conformance.
Drawing / record digitization: OCR on as-builts and legacy drawings; auto-tagging to layers and BIM elements.
Inventory & site logistics: Count materials, detect idle equipment; geofence violations.
“Would you deploy CV on edge cameras first, or start with drone/UAV workflows?”
3. CV-in-the-loop pipeline for Geo/BIM
Data sources → Models → Spatial/BIM fusion → Actions
Capture
Fixed cameras (RTSP), mobile, UAV (RGB + multispectral), 360° cameras, LiDAR.
Scheduled UAV missions over corridors (roads, rail, utilities) and sites.
Pre-process
Frame sampling, dewarping, stabilization; orthorectification for UAV images.
Tiling/patching for large orthos; class balancing and augmentations.
Modeling
Detection/segmentation: YOLO/RT-DETR/Mask R-CNN for defects, PPE, components.
3D registration: Align detections to point clouds/BIM coordinates (ICP, PnP).
Tracking: Multi-object tracking for counts, dwell time, unsafe proximity.
Geo/BIM fusion
Snap detections to GIS layers (roads, parcels, utilities).
Map detections to BIM elements via GUIDs; write back to CDE.
Maintain CRS integrity (EPSG codes) and BIM coordinate transforms.
Actioning
Create work orders (CMMS/ERP), issues (BIM 360, Navisworks BCF), or safety alerts (MS Teams/WhatsApp).
Route by discipline , zone , and priority .
Operate & improve
Human-in-the-loop review queues; active learning for re-training.
Telemetry on precision/recall, latency, and cost per processed frame.
4. Reference architecture pyramid
Top: Cost of rework, safety incidents, schedule slippage, regulatory audits.
Middle: Data & AI: curated imagery datasets, model registry, labeling ops. Process & Automation: event-driven pipelines (ingest → detect → ticket). Digital Models: BIM (IFC/Revit), GIS (GeoPackage/GeoJSON), twins (synchronization rules). Experience: role-based dashboards for site, QA/QC, and management. Platforms & People: CDE integration, upskilling for reviewers/labelers.
Base: Governance, privacy/security, data management, Cloud/IaC, integration (APIs/events), observability/SRE, DevSecOps, FinOps, risk/compliance.
5. Deployment patterns
Edge-first for latency & privacy: Run PPE/defect models on Jetson/CPU near cameras; push only detections/embeddings to cloud.
Cloud-first for batch UAV data: Heavy models and ortho/point-cloud fusion on GPU nodes; schedule via workflow engine.
Hybrid: Real-time alerts on edge; weekly geo-registered condition maps in cloud.
6. Data considerations
Labeling strategy: Start with 10–20 classes that drive business value; keep class names stable.
Sampling: Balance across lighting, weather, camera angles, and materials.
Quality gates: Target model precision/recall ≥ 0.85 on critical classes before automation.
Versioning: Dataset, model, and labeling guideline versions must be tracked.
7. KPIs that matter (track weekly)
Detection precision/recall by class
False alarm rate on safety events
Time-to-issue (capture → ticket)
Defect escape rate and rework cost
Cost per processed minute of video / per km of corridor
Cycle time from detection → closure
8. Use case example (India): Road maintenance + BIM/Geo
Context: State PWD pilots visual analytics across 1,000 km of roads. Dash-cams + UAVs capture imagery monthly. Pipeline:
Ingest images → detect potholes/rutting/edge breaks → snap to centerline (GIS).
Aggregate severity by link/chainage → generate prioritized work orders (CMMS).
Update digital twin and BIM of structures (culverts/bridges) with condition tags. Outcome (illustrative): 30–50% faster surveys, 15–25% fewer repeat visits, measurable reduction in emergency patching.
9. Benefits & ROI (summary)
Fewer site visits: automate first-pass inspections.
Faster close-out: detections create tickets with location + BIM element IDs.
Lower rework: earlier detection of defects and clashes.
Safety uplift: continuous monitoring where humans can’t stand.
Auditability: visual evidence tied to GIS/BIM for claims and compliance.
Scalable economics: commodity cameras and UAVs; edge inference reduces cloud spend.
Conclusion
CV adds the “eyes” your geospatial and BIM stacks were missing. Start small, one corridor, one plant line, or one high-risk activity, then scale with clear KPIs and feedback loops. The winners will be those who fuse detections with spatial and BIM context and route them into existing work systems. That is where value turns into outcomes.
Note: All the visuals used in this article are illustrative.