Digital Twin projects often begin with strong expectations.
Organizations expect better visibility, faster decisions, predictive insights, lower downtime, improved maintenance, reduced energy use, better asset utilization, and smarter operations.
But once the pilot starts, one question becomes unavoidable:
How do we measure ROI quickly and credibly?
This is important because many Digital Twin projects struggle not because the technology fails, but because value is not measured early enough.
A Digital Twin pilot should not wait one or two years to prove whether it is useful. It should show early signals of value within the first 90 days.
This does not mean the full return on investment must be realized in 90 days. That may not be realistic for large infrastructure, manufacturing, utility, or smart city programs.
But within 90 days, the organization should be able to answer:
Are we solving the right problem?
Is the data useful?
Are users adopting the system?
Are decisions improving?
Are measurable benefits becoming visible?
Do we have enough evidence to scale?
That is the real purpose of a 90-day ROI measurement approach.
ROI Should Begin Before Implementation
Many organizations make the mistake of measuring ROI only after the Digital Twin is deployed.
That is too late.
ROI measurement should begin during the planning stage.
Before implementation starts, the team should define:
the baseline,
the business problem,
the expected improvement,
the value indicators,
the users involved,
the data sources,
the measurement method,
the success threshold.
Without a baseline, there is no clear way to prove improvement.
For example, if the Digital Twin is expected to reduce equipment downtime, the team should know the current downtime level before the pilot begins.
If it is expected to reduce energy consumption, the baseline energy usage must be captured.
If it is expected to improve inspection efficiency, the current inspection time, reporting time, and rework levels should be documented.
A Digital Twin does not prove ROI by existing.
It proves ROI by improving something that matters.
What Can Be Measured in 90 Days?
A 90-day period is enough to measure early operational signals.
It may not be enough to prove long-term asset life extension, full enterprise transformation, or multi-year savings. But it is enough to prove whether the Digital Twin is moving in the right direction.
In 90 days, organizations can measure:
time saved,
faster issue detection,
improved visibility,
reduction in manual reporting,
improved user adoption,
better data availability,
reduced inspection effort,
improved response time,
early energy savings,
fewer repeated errors,
improved decision confidence,
better maintenance prioritization,
early reduction in downtime,
readiness for scale.
The key is to choose metrics that match the use case.
A predictive maintenance Digital Twin should not be measured in the same way as a road monitoring Digital Twin or an energy optimization Digital Twin.
ROI must be use-case specific.
Step 1: Define the Business Outcome
The first step is to define the business outcome clearly.
Do not begin with vague goals like:
“We want better visibility.”
Visibility is useful, but it is not enough.
A stronger outcome would be:
“We want to reduce unplanned downtime on one critical production line.”
Or:
“We want to reduce manual inspection time for one road corridor.”
Or:
“We want to reduce energy consumption in one building zone.”
Or:
“We want to improve response time for utility faults in one service area.”
A business outcome should be specific, measurable, and connected to operational value.
CXOs and business heads should be able to understand why the outcome matters.
Step 2: Establish the Baseline
The baseline is the current state before the Digital Twin pilot.
This may include:
average downtime per month,
inspection time per asset,
energy consumption per day,
maintenance response time,
number of manual reports,
time spent searching for data,
number of unresolved alerts,
asset utilization rate,
cost of repeated failures,
number of site visits,
compliance reporting effort,
delay in decision-making.
The baseline does not need to be perfect, but it must be credible.
If the data is incomplete, document the assumption.
For example:
“Current inspection reporting takes approximately 3 days based on the last 10 inspection cycles.”
Or:
“Current average downtime is estimated from maintenance records and supervisor inputs.”
A transparent baseline is better than no baseline.
Step 3: Select 3-5 ROI Metrics
One common mistake is measuring too many things.
For a 90-day pilot, select only 3-5 meaningful metrics.
These should include a mix of financial, operational, and adoption indicators.
For example, a predictive maintenance pilot may measure:
reduction in unplanned downtime,
improvement in issue detection time,
reduction in maintenance response time,
number of prevented failures,
user adoption by maintenance team.
An energy optimization pilot may measure:
reduction in energy consumption,
peak load reduction,
number of abnormal consumption events detected,
faster reporting,
user actions taken based on insights.
A road monitoring pilot may measure:
inspection time reduced,
number of defects detected,
accuracy of defect classification,
time saved in reporting,
prioritization of maintenance actions.
A warehouse visibility pilot may measure:
reduction in asset search time,
improvement in asset utilization,
reduction in movement delays,
number of workflow exceptions detected,
user adoption.
The best ROI metrics are simple enough to track and strong enough to support a scale decision.
Step 4: Separate Hard ROI and Soft ROI
Digital Twin ROI usually has two layers.
Hard ROI
Hard ROI is easier to quantify financially.
Examples include:
reduced downtime cost,
lower maintenance cost,
lower energy bills,
reduced inspection cost,
fewer site visits,
reduced rework,
lower equipment failure cost,
better asset utilization,
reduced reporting effort.
Hard ROI is important because it supports investment decisions.
Soft ROI
Soft ROI is harder to convert directly into money, but still valuable.
Examples include:
better decision confidence,
improved data trust,
faster coordination,
improved safety awareness,
better compliance readiness,
improved stakeholder visibility,
reduced operational uncertainty,
improved planning quality,
stronger governance.
Soft ROI should not be ignored.
Many Digital Twin benefits begin as soft ROI and become hard ROI over time.
For example, better decision confidence may later reduce downtime. Improved data trust may later reduce rework. Faster coordination may later reduce delays.
In the first 90 days, both types of ROI should be captured.
Step 5: Measure User Adoption
A Digital Twin cannot deliver ROI if users do not adopt it.
User adoption is one of the strongest early indicators of success.
Measure:
number of active users,
frequency of usage,
number of actions taken,
number of reports generated,
number of alerts reviewed,
number of decisions supported,
feedback from users,
reduction in parallel manual processes.
If users still rely only on spreadsheets, phone calls, emails, or manual reports, the Digital Twin may not be embedded into operations.
Adoption shows whether the solution is becoming useful.
A technically successful pilot with weak user adoption may not scale.
Step 6: Track Decision Improvement
The purpose of a Digital Twin is not only to display information.
It should improve decisions.
A 90-day ROI review should ask:
Did decisions become faster?
Did decisions become more data-driven?
Were risks identified earlier?
Were maintenance actions prioritized better?
Were site visits reduced?
Were issues escalated faster?
Were teams able to act with more confidence?
Did the Digital Twin reduce guesswork?
This is where the Digital Twin moves from dashboard to decision-support system.
If decision-making does not improve, ROI will remain weak.
Step 7: Link Metrics to Financial Value
Once operational improvements are measured, they should be translated into financial value where possible.
For example:
If downtime reduced by 10 hours and each hour of downtime costs ₹50,000, the avoided loss is ₹5,00,000.
If inspection time reduced from 5 days to 2 days, calculate the labour cost saved, faster reporting benefit, and improved maintenance planning value.
If energy usage reduced by 8%, calculate the monthly cost saving and annualized potential.
If site visits reduced by 20%, calculate travel cost, manpower cost, and time saved.
The financial model does not need to be complex at pilot stage.
It should be simple, transparent, and tied to actual operational change.
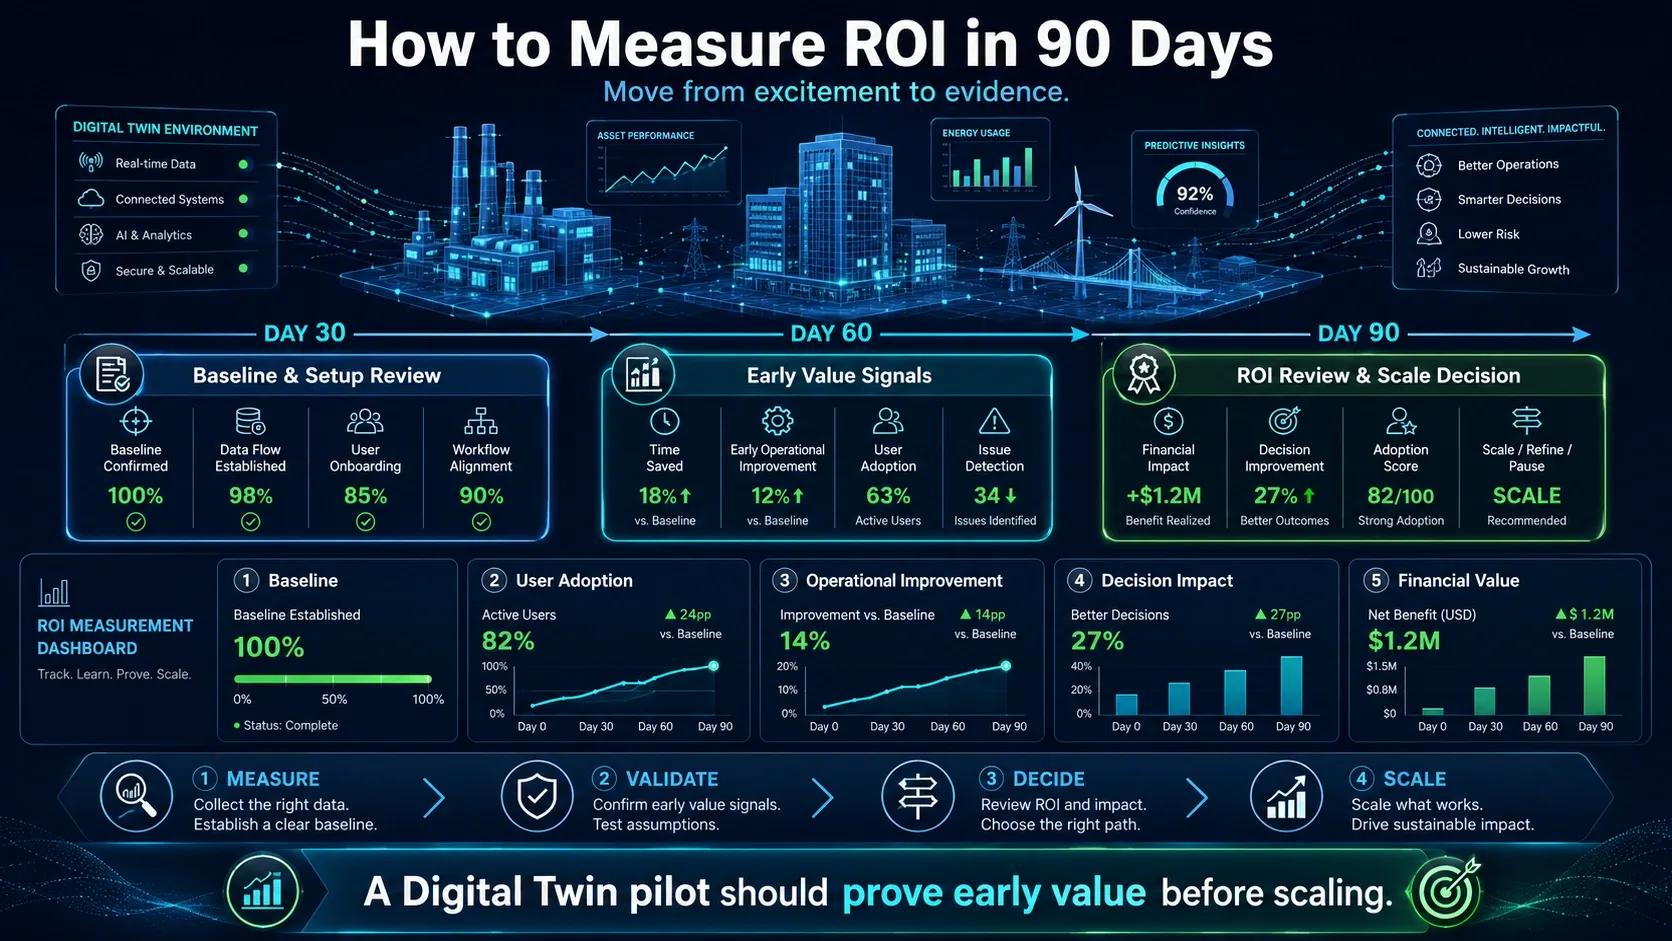
Step 8: Review ROI at 30, 60, and 90 Days
Instead of waiting until the end, conduct three ROI checkpoints.
Day 30: Baseline and Setup Review
At this stage, review:
whether data is flowing,
whether users are onboarded,
whether dashboards are working,
whether baseline metrics are confirmed,
whether early issues are visible,
whether workflows are aligned.
Day 30 is not about proving ROI fully.
It is about confirming that measurement is possible.
Day 60: Early Value Signals
At this stage, review:
early improvements,
user adoption,
alert usefulness,
time saved,
data quality gaps,
workflow adjustments,
early operational benefits.
Day 60 should show whether the pilot is moving toward value.
Day 90: Scale Decision
At this stage, review:
measured improvements,
ROI indicators,
user feedback,
data readiness,
integration performance,
cost versus benefit,
scale potential,
next-phase investment requirement.
Day 90 should support a clear decision:
Scale.
Refine.
Pause.
Or stop.
This decision discipline is important.
Not every pilot should automatically scale. Some pilots may need redesign. Some may reveal that the use case is not strong enough. Some may show strong potential and justify wider rollout.
A Simple 90-Day ROI Framework
Organizations can use a simple framework:
Phase - Focus - Output
Days 1–30 - Baseline, setup, data flow, user onboarding - Confirm measurement readiness
Days 31–60 - Early operational improvements - Identify value signals
Days 61–90 - ROI review and scale decision - Decide scale, refine, pause, or stop
This framework keeps the pilot disciplined.
It prevents the project from drifting into an open-ended technology experiment.
Example: Predictive Maintenance Pilot
Let us consider a manufacturing plant running a Digital Twin pilot for predictive maintenance on one critical production line.
Baseline
Average unplanned downtime: 20 hours/month
Downtime cost: ₹40,000/hour
Average response time: 4 hours
Maintenance reporting time: 2 days
Data sources: sensor readings, maintenance logs, asset register, production schedule
90-Day Target
Reduce downtime by 10–15%
Reduce response time by 25%
Detect abnormal conditions earlier
Improve maintenance prioritization
Reduce manual reporting effort
Possible 90-Day ROI
If downtime reduces by 6 hours over 90 days:
6 hours × ₹40,000 = ₹2,40,000 avoided downtime cost.
If maintenance reporting effort reduces by 40 hours:
40 hours × internal labour cost = additional productivity gain.
If early detection prevents one major failure, the value may be even higher.
This is not the full ROI of the Digital Twin.
But it gives early evidence.
It helps leadership decide whether to scale to more assets or lines.
Example: Energy Optimization Pilot
For a building or campus energy Digital Twin, the 90-day ROI may include:
baseline energy consumption,
peak demand patterns,
abnormal consumption events,
equipment scheduling inefficiencies,
HVAC operating anomalies,
energy savings achieved,
projected annual savings.
If the pilot reduces energy consumption by 5–8% in one zone, that can be annualized and compared with implementation cost.
This gives leadership a practical view of financial impact.
Example: Road Condition Monitoring Pilot
For a road monitoring Digital Twin, ROI may be measured through:
reduced manual inspection time,
faster defect detection,
better prioritization of potholes or pavement issues,
reduction in repeat inspections,
improved maintenance planning,
faster reporting to authorities,
more transparent budget allocation.
Here, ROI may not only be financial. It may also include safety, service quality, and governance value.
The ROI Dashboard
A 90-day pilot should have a simple ROI dashboard.
It may include:
baseline value,
current value,
improvement percentage,
estimated financial impact,
user adoption,
open issues,
data quality score,
scale recommendation.
The dashboard should not be overloaded.
It should help leadership quickly understand whether the pilot is working.
Avoid These ROI Mistakes
Mistake 1: Measuring Technology Usage Only
System usage is important, but ROI requires operational impact.
Login counts alone do not prove value.
Mistake 2: No Baseline
Without a baseline, improvement cannot be proven.
Mistake 3: Measuring Too Many Metrics
Too many metrics create confusion. Select the few that matter.
Mistake 4: Ignoring Adoption
If users do not act on the insights, ROI will remain weak.
Mistake 5: Expecting Full ROI Too Early
A 90-day pilot should prove direction, not complete transformation.
Mistake 6: Ignoring Soft ROI
Trust, confidence, coordination, and data maturity are early value signals that often lead to financial ROI later.
Closing Thought
A Digital Twin should not be judged only by how advanced it looks.
It should be judged by what it improves.
In the first 90 days, the goal is not to prove the entire business case forever.
The goal is to create credible evidence.
Evidence that the right problem is being addressed.
Evidence that data can support decisions.
Evidence that users are adopting the system.
Evidence that operational improvements are visible.
Evidence that there is a practical path to ROI.
A 90-day ROI framework helps organizations move from excitement to evidence.
It helps leadership decide whether to scale, refine, pause, or stop.
That is how Digital Twin projects become disciplined investments instead of open-ended experiments.