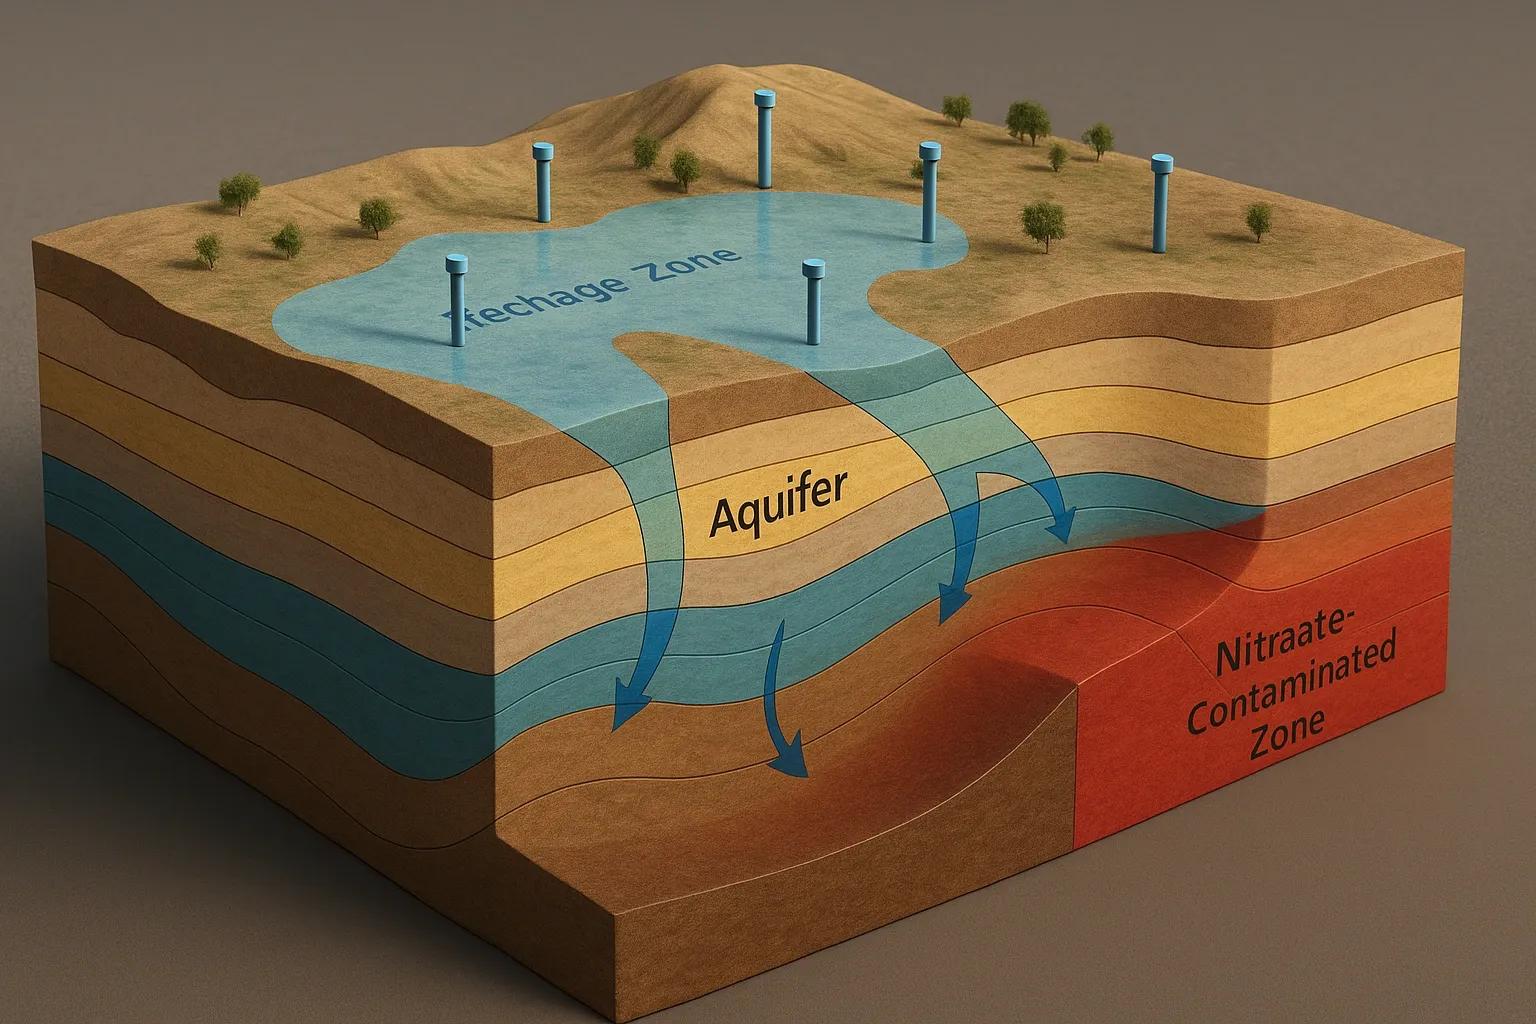
The Map Beneath the Map
What lies beneath is more structured than it seems.
Groundwater, invisible yet indispensable, forms a vast hidden raster , layered in sands, fractures, and porous rock. Each pixel of this subsurface grid holds clues to storage, recharge, and contamination.
We may not see aquifers from space, but with remote sensing, GIS modeling, and geophysical data , we can now map their logic as precisely as any surface feature.
Reading the Invisible: Aquifers as Spatial Layers
Aquifers are natural storage systems that behave like 3D rasters, with properties varying by cell:
Hydraulic Conductivity (K) : how easily water moves through each unit.
Storage Coefficient (S): how much water each cell can hold.
Recharge Rate (R): how quickly water enters the aquifer from surface infiltration.
Quality Index (Q): concentration of dissolved solids, nitrates, or heavy metals.
In GIS, these attributes are stored as continuous raster layers , allowing spatial interpolation, temporal analysis, and predictive modeling.
Every dataset, from rainfall to land use, contributes to decoding this invisible geospatial grid.
Remote Sensing for Groundwater Insight
While groundwater itself can’t be directly imaged, its behavior leaves detectable surface signatures.
1️⃣ GRACE & GRACE-FO Satellites
Detect gravity anomalies caused by groundwater storage changes.
Each monthly grid cell (~100 km resolution) reflects gain or loss in aquifer mass.
Key for regional-scale trend mapping in North India, where depletion exceeds 4–5 cm/year equivalent water height.
2️⃣ InSAR (Interferometric SAR)
Measures surface subsidence due to groundwater extraction, a proxy for aquifer compaction.
Example: Delhi NCR subsidence rates up to 11 cm/year correlate with falling water tables.
3️⃣ Optical & Thermal Sensors (Landsat, Sentinel-2)
Identify recharge zones via vegetation anomalies, soil moisture, and land surface temperature differentials.
4️⃣ DEM-Based Recharge Modeling
Flow accumulation, slope, and lithology maps integrate to delineate potential recharge areas .
By combining these inputs, GIS workflows create Groundwater Potential Maps (GWPM) , the foundation for sustainable extraction planning.
India’s Groundwater Paradox
India extracts nearly 250 billion cubic meters of groundwater annually, the world’s largest user.
Yet over 60% of aquifers are in critical or semi-critical condition (CGWB, 2023).
The contrast is stark:
Northwestern Plains (Punjab, Haryana, Delhi): Overdrawn, high depletion zones.
Peninsular Hard Rock Terrains (Deccan, Telangana): Highly variable recharge with fracture-controlled storage.
Indo-Gangetic Alluvium: Thick, productive aquifers but nitrate-prone.
Coastal Aquifers: Threatened by saline intrusion.
Remote sensing and field surveys together offer the only scalable solution, detecting both where water is stored and where it’s being lost or polluted.
Mapping Recharge and Pollution Together
Groundwater sustainability requires understanding the balance between input (recharge) and degradation (contamination) .
Recharge Zonation via GIS:
Derived from rainfall, slope, soil permeability, NDVI, and drainage density.
Weighted overlay (AHP or fuzzy logic) produces a Recharge Index Map .
Nitrate Contamination Mapping:
Integrates land use (agriculture, wastewater), geology, and well-sampling data.
Spatial interpolation (Kriging/IDW) produces a Nitrate Concentration Raster .
Correlating recharge zones with nitrate plumes identifies vulnerable infiltration corridors.
In simple terms, the same paths that recharge aquifers also carry pollution , a critical insight for water quality management.
Case Example: Nitrate Mapping in Telangana
In southern Telangana, researchers combined well samples, Sentinel-2 NDVI, and CartoDEM to map nitrate contamination:
480 wells analyzed across semi-arid hard rock terrain.
Nitrate concentrations >45 mg/L in 28% of samples, especially in recharge-prone zones near agricultural fields.
Overlay with lineament density and land use layers identified fertilizer runoff pathways feeding shallow aquifers.
This geospatial approach turned field chemistry into a spatially interpretable model , enabling site-specific mitigation like recharge pit placement and fertilizer management.
Toward Groundwater Digital Twins
The next evolution is linking sensor networks and models to form a Groundwater Digital Twin:
Sensors: Monitor water levels, conductivity, and nitrate concentrations in real time.
Models: Integrate MODFLOW simulations with weather, land use, and pumping data.
Visualization: 3D voxel models display aquifer dynamics and pollution spread.
AI Integration: Predicts depletion hotspots and contamination risks.
Such a twin transforms groundwater management from static surveys to adaptive decision systems , where policy, extraction, and recharge strategies evolve with data.
Outlook: From Scarcity to Intelligence
India’s groundwater crisis isn’t a data problem, it’s a data integration problem.
When GRACE satellites, IoT wells, and field nitrate readings merge into one geospatial layer, the invisible becomes actionable.
In this sense, the future of water security depends not just on finding new sources, but on mapping what’s already beneath us, pixel by pixel.
Conclusion
Groundwater may be hidden, but it’s not unknowable.
Through geospatial science, we can now visualize its flow, health, and decline, transforming the unseen aquifer into a living, measurable data layer.
It’s time we treat the subsurface not as a mystery, but as a managed system, one that demands precision, not approximation.