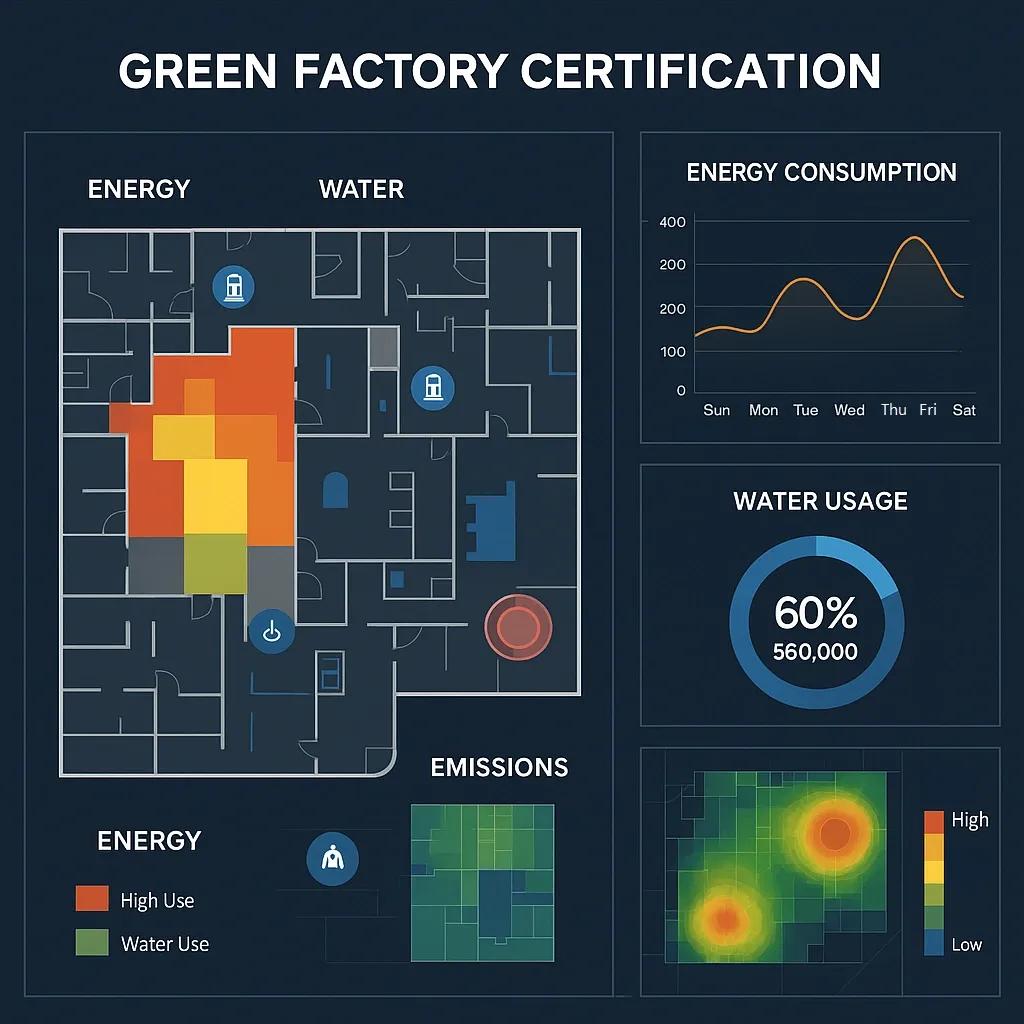
As the manufacturing sector embraces sustainability, the demand for Green Factory Certification has grown significantly. These certifications, such as LEED (Leadership in Energy and Environmental Design), ISO 14001, and India's GRIHA for industries, require comprehensive tracking and reporting of environmental performance metrics like energy consumption, water use, and emissions. While traditional methods rely heavily on spreadsheets and standalone monitoring tools, Geographic Information Systems (GIS) dashboards offer a transformative way to manage this data spatially, connecting factory layout with operational efficiency down to the production line.
This article explores how GIS dashboards support green factory certification by integrating real-time environmental data with geospatial visualization, enabling informed decision-making at all levels.
1. What Is a Green Factory?
A Green Factory refers to a manufacturing facility designed or retrofitted to reduce its ecological footprint. These facilities focus on:
Energy efficiency through optimized machinery and renewable sources
Water conservation via recycling, rainwater harvesting, and metering
Waste management including reduction, reuse, and proper disposal
Emission control with air purification, ventilation, and carbon monitoring
Certification programs require ongoing data reporting to validate these environmental goals. This is where GIS dashboards become a critical tool for both real-time monitoring and historical data analysis.
2. Role of GIS in Green Factory Certification
GIS dashboards allow spatial representation of environmental data across the physical layout of a factory, integrating IoT sensors, SCADA systems, and utility meters. These dashboards serve four key purposes:
Spatial Contextualization : Maps out energy, water, and emissions data across building zones, machine clusters, and utility points
Real-Time Monitoring : Tracks metrics live with dynamic visualization
Anomaly Detection : Quickly flags performance deviations across operational zones
Certification Reporting : Aligns data to certification requirements like LEED Energy Performance or ISO 14001 Environment Management System KPIs
This enables auditors, managers, and ESG officers to assess both the macro (building-wide) and micro (line-level) environmental impact efficiently.
3. Key Environmental Metrics Tracked
a. Energy Consumption
Smart meters installed across equipment and zones feed usage data into the dashboard
GIS visualization displays high-consumption areas by color coding (e.g., red zones for energy-intensive units)
Enables optimization by identifying idle loads, aging machinery, or poor insulation in specific factory zones
b. Water Use
Tracks water flow from source to usage points, restrooms, boilers, cooling systems, and process water
Spatial mapping of water pipelines and meters identifies leakage points and overuse
Supports water reuse analysis and rainwater harvesting integration tracking
c. Emissions and Air Quality
Air quality monitors (CO₂, VOCs, particulate matter) are geotagged across the plant
GIS overlays provide heatmaps for emission intensity by section
Helps validate emission controls, proper ventilation, and air scrubbing system performance
4. From Layout to Line-Level Insight
The advantage of GIS lies in its multi-scale capability:
Facility-Level
Total site energy and water footprints
Spatial allocation of green zones, solar rooftops, rainwater pits
Perimeter emission compliance and buffer zone planning
Floor-Level
Consumption patterns across departments
Comparative analysis of HVAC zones
Interactive toggling of environmental KPIs per floor
Line-Level
Machine-level energy draw and emissions
Fault detection in specific units or circuits
Maintenance alerts based on spatially-tagged thresholds
This granular control is invaluable for continuous improvement initiatives, enabling both operational efficiency and sustainability gains.
5. Integration with IoT and SCADA
A smart green factory integrates GIS with:
IoT sensors for live feeds (temperature, humidity, vibration, energy)
SCADA systems for control and automation signals
Digital Twin models for simulation and scenario planning
The GIS dashboard acts as a unifying front-end, layering real-time operational data on spatial layouts. It allows managers to simulate process changes, such as introducing a new HVAC zoning plan or upgrading a production line and immediately estimate energy/emission impacts spatially.
6. Certification Alignment and Reporting
Different certifications require varied evidence formats. GIS dashboards can be configured to:
Map data to LEED Energy and Atmosphere (EA) credits or Water Efficiency (WE) points
Generate ISO 14001 audit-ready reports with location-linked incident logs
Support GRIHA criteria, like natural lighting spatial analysis or renewable integration footprint
Dashboards can also export compliance snapshots showing facility layout with overlays for solar energy contribution, green cover, waste segregation zones, etc., which help during certification site audits.
7. Example: Gartex Manufacturing Pvt. Ltd. in Telangana
Gartex wanted to achieve LEED Gold certification for its 12,000 sq. meter garment manufacturing unit. It deployed:
65 IoT sensors tracking power use across machinery
Smart water meters connected to a GIS dashboard
Real-time AQI monitors in dyeing and ironing sections
Using the GIS dashboard, Gartex:
Identified a 17% energy wastage in the old cutting section
Tracked water reuse from ETPs, increasing reuse by 30%
Flagged two emission hotspots, leading to improved ducting
The certification body acknowledged the GIS dashboard reports as a digital twin layer, enhancing the audit and verification process.
8. Benefits of GIS Dashboards for Green Factories
Benefit - Description
Improved Transparency - Clear, real-time visibility of environmental performance
Proactive Maintenance - Early warnings reduce waste and downtime
Faster Certification - Easier data consolidation, visualization, and reporting
Cross-Functional Use - Usable by energy managers, facility heads, compliance teams
Audit Trail - Every spatial metric is timestamped and logged
Stakeholder Engagement - Visual tools improve communication with investors and certifiers
9. Challenges and Considerations
Data Overload : Excessive sensors without proper filtering can lead to noise
System Integration : Linking SCADA, IoT, and ERP into GIS needs planning
Training : Teams need familiarity with spatial dashboards and interpretation
Cost : Upfront investment in sensors and platform development may be high for SMEs
However, the long-term ROI from utility savings, faster certification, and ESG performance often justifies the cost.
10. The Road Ahead: Toward Autonomous Green Monitoring
As AI and machine learning evolve, GIS dashboards will become smarter:
Predictive energy modelling for peak shaving
Autonomous alerts for emission control failures
Integration with Blockchain for traceable sustainability audits
Use of satellite imagery for monitoring green belt growth and heat maps
Eventually, the GIS dashboard may serve as the central brain of sustainable operations, blending spatial analytics, automation, and certification tracking.
Conclusion
Green factory certification is no longer a checkbox, it’s a strategic asset. GIS dashboards bring clarity, control, and confidence to the process by uniting spatial awareness with real-time data. From identifying inefficiencies at the machine level to supporting compliance across global standards, GIS dashboards are essential for the next generation of intelligent, sustainable manufacturing.