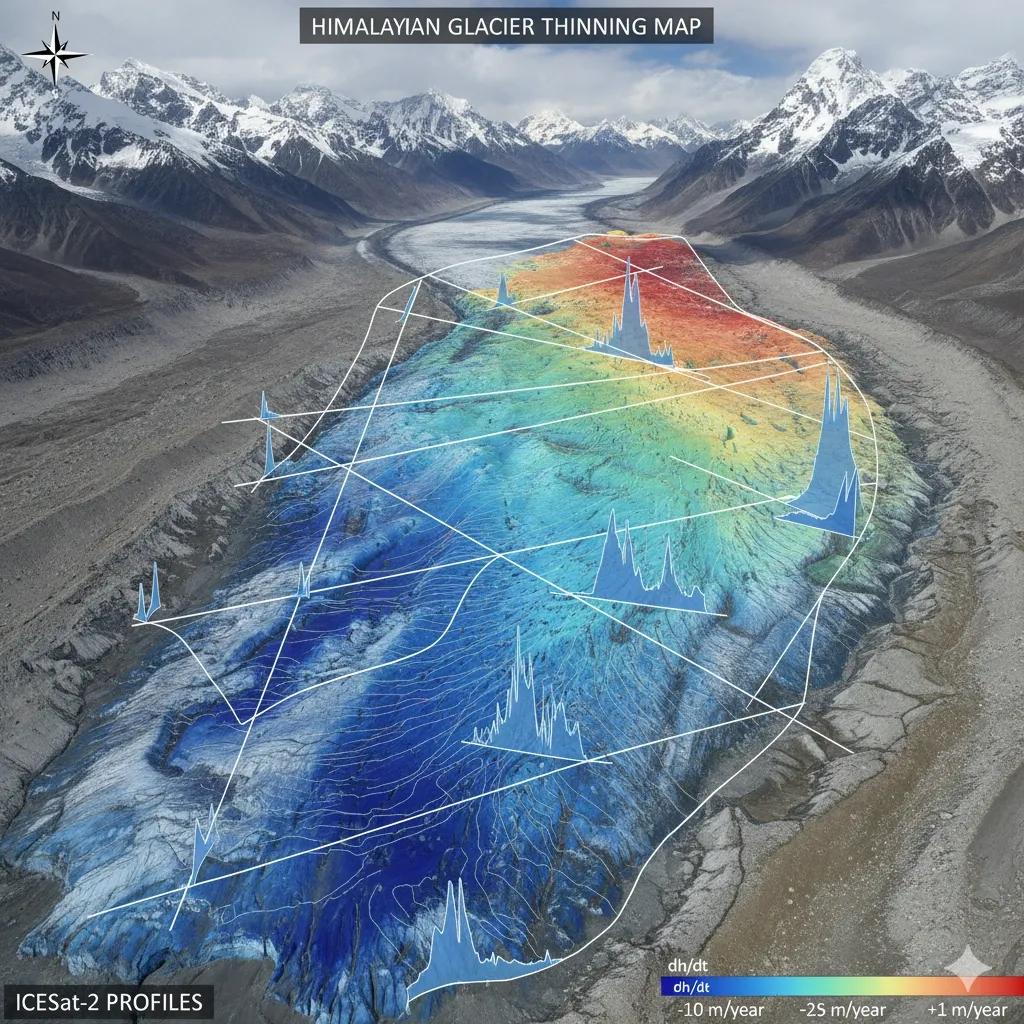
The Shrinking Ice Ledger of the Himalaya
Glaciers are the high-altitude reservoirs of South Asia, slow-moving archives of snow, ice, and climate.
But they are thinning at rates never recorded before.
To understand this loss, we need more than field expeditions; we need spaceborne elevation intelligence .
Today, SAR interferometry , ICESat-2 photon altimetry , and multi-epoch DEM differencing allow us to compute one of the most important metrics in cryosphere science:
dh / dt = "change in glacier surface elevation per year"
This is glacier mass balance in its purest spatial form, a direct, pixel-level measure of ice loss or gain.
Why Elevation Change Matters More Than Area Change
Traditional glacier monitoring focused on area shrinkage .
But two glaciers with similar area loss may have very different mass balances .
Elevation change, not outline change, tells the real story:
How fast a glacier is thinning
Where ablation is concentrated
Whether accumulation zones are still functioning
How much water is being released downstream
dh/dt maps turn glaciers into 3D climate sensors , capturing both surface lowering and dynamic thinning.
ICESat-2: Photon Counting the Himalaya
Launched in 2018, ICESat-2 ATL06 uses photon-counting LiDAR to measure elevation with ±3–5 cm precision .
With ground tracks ~17 m wide and spacing ~90 m, it provides:
High-accuracy elevation profiles
Multi-year repeat passes
Fine-scale detection of thinning on glacier tongues
Reliable accumulation zone height changes
Its biggest strength: absolute elevation accuracy , essential for long-term glacier mass balance.
SAR Interferometry: The Elevation Change Engine
While ICESat-2 gives precise tracks , SAR interferometry (InSAR) gives spatial continuity across entire glacier surfaces.
Sensors used:
Sentinel-1 (C-band)
TerraSAR-X (X-band)
ALOS PALSAR-2 (L-band)
Methods:
DEM differencing: Compare DEMs from 2000 (SRTM), 2015–16 (TanDEM-X), and 2020–24 composites.
Coherent InSAR: Track phase change in dry-snow zones.
Amplitude tracking: Useful when coherence is low on fast-flow glaciers.
Outputs:
Annual dh/dt maps at 10–30 m resolution
Thickness loss patterns along flowlines
Elevation change gradients from accumulation to ablation zones
Together, ICESat-2 × SAR fusion provides absolute + spatial mass balance accuracy .
Mapping Glacier Mass Balance: The dh/dt Workflow
1️⃣ Elevation Dataset Preparation
Baseline: SRTM (2000) or ASTER GDEM
Modern: TanDEM-X, ArcticDEM (Him DEM), ICESat-2 ATL06 points
Co-registration using Nuth & Kääb (2011) correction
2️⃣ Compute Elevation Change
dh = h(t2) – h(t1)
Multi-year dh maps are converted into:
dh / dt = [h(t2) – h(t1)] / t
3️⃣ Mask Glacier Boundaries
Using Randolph Glacier Inventory (RGI) or updated Sentinel-1 glacier outlines.
4️⃣ Convert Elevation Change → Mass Balance
Assume density of ice/snow (850–900 kg/m³) to convert volume change → mass change.
India’s Himalayan Glacier Trends (Recent Findings)
Based on 2000–2020 DEM differencing and ICESat-2 transects:
Western Himalaya: −0.2 to −0.4 m/year thinning
Central Himalaya: −0.5 to −1.0 m/year
Eastern Himalaya: −0.3 to −0.8 m/year
Some glaciers around Nanda Devi, Gangotri, and Zanskar show thinning >1.2 m/year in ablation zones.
Debris-covered glaciers show slower surface lowering but faster subsurface mass loss , captured better via ICESat-2.
Case Example: Gangotri Glacier dh/dt Map
A 2023 analysis fused:
ICESat-2 ATL06 tracks from 2019–2023
TanDEM-X 2015 DEM
Sentinel-1 SAR velocity fields
Findings:
Mean thinning: −0.68 m/year
Maximum thinning: −1.5 m/year at lower 5 km of the tongue
Accumulation zone rise: +0.10 to +0.25 m/year from increased winter snowfall
The dh/dt raster now supports the Chardham highway risk assessment , highlighting zones of potential meltwater surge.
GeoAI for Glacier Monitoring
AI models now automate elevation change detection:
U-Net / ResNet: Enhance snow–ice classification for DEM masking
LSTM: Model long-term elevation trajectories
CNNs on SAR amplitude: Detect glacier flow and thinning hotspots
Point-cloud ML: Interpolate ICESat-2 tracks into dense surfaces
These tools reduce uncertainty by learning glacier-specific spectral/structural behavior .
Toward Glacier Digital Twins
A Glacier Digital Twin integrates:
dh/dt rasters
Flow velocity
Snow accumulation models
Meltwater release estimates
Lake formation forecasts (GLOFs)
Such a twin can:
Simulate glacier retreat scenarios
Predict glacial lake expansion
Model water availability under warming
Provide risk analytics for hydropower and mountain roads
This is critical for India’s Himalayan State Climate Action Plans , where water security and disaster risk converge.
Conclusion
Glacier mass balance is no longer inferred, it is measured .
Through SAR elevation differencing and ICESat-2 photon altimetry, we can now map thinning at meter-level precision and forecast meltwater futures with confidence.
Each dh/dt map is a climate signal, a spatial heartbeat of the Himalaya.