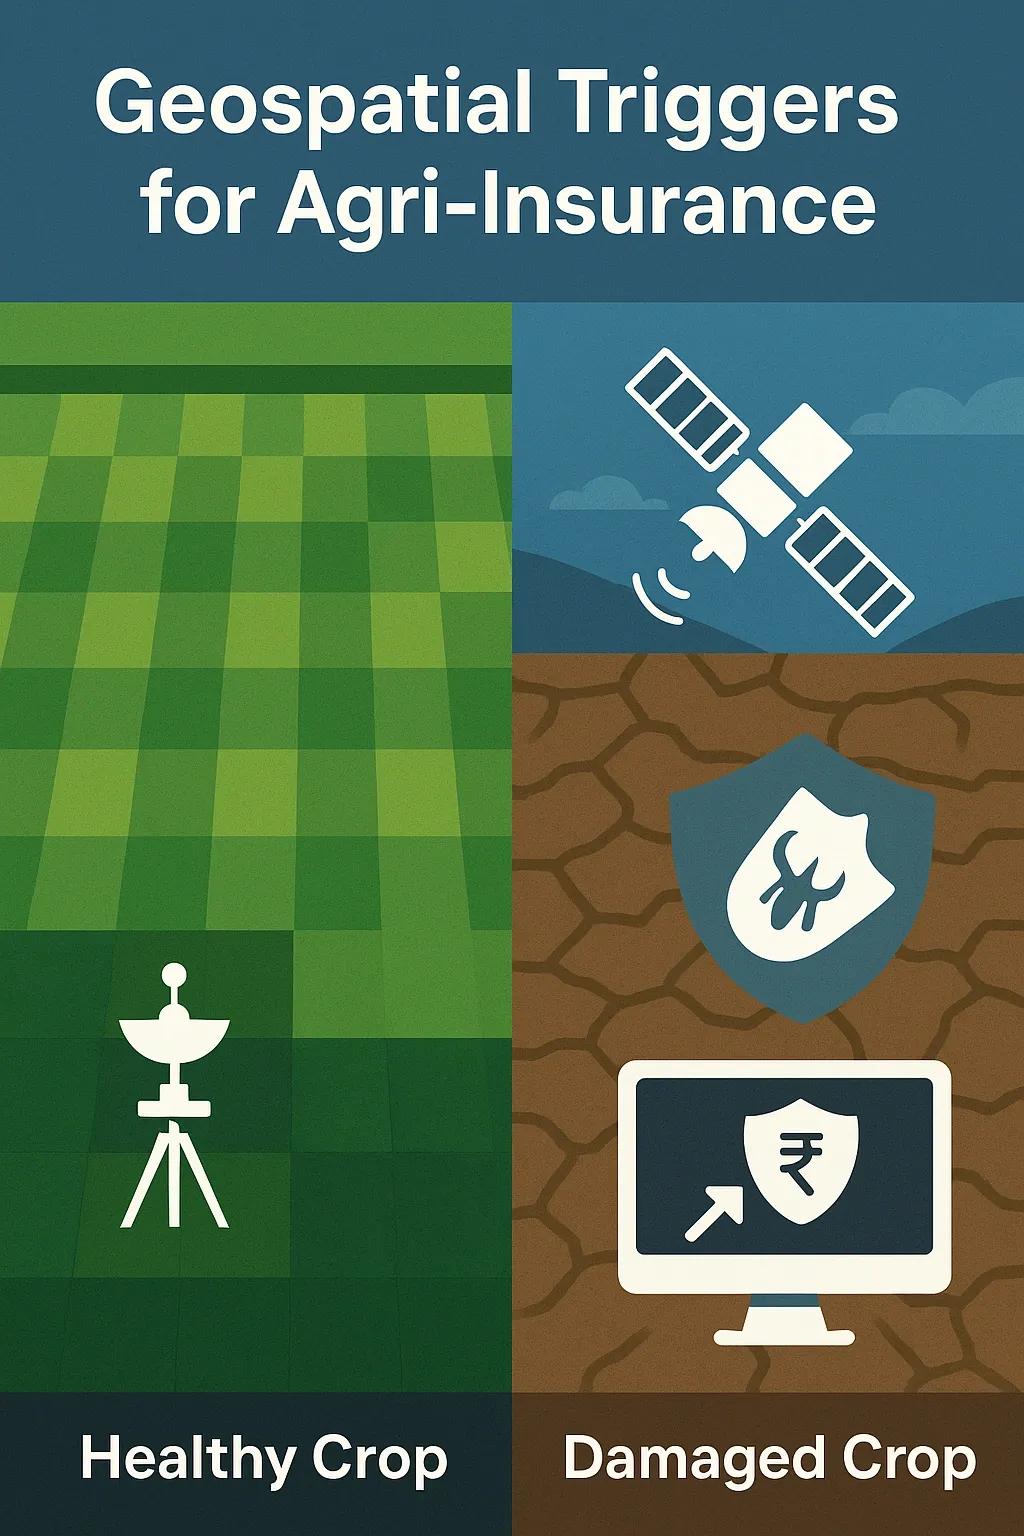
Agriculture is inherently vulnerable to unpredictable natural events such as droughts, floods, hailstorms, and pest outbreaks. These risks often lead to crop losses that are hard to verify, resulting in delayed or disputed insurance payouts. Traditional claim assessment methods depend on manual field inspections, which are time-consuming, labor-intensive, and subject to human error or manipulation.
To address these limitations, the integration of geospatial triggers, automated indicators derived from remote sensing and spatial analytics, is transforming the agri-insurance sector. These technologies enable objective, timely, and scalable decision-making for insurance payouts based on observed spatial loss patterns.
The Shift Toward Parametric Insurance
Agri-insurance models are shifting from indemnity-based to parametric insurance. In this model, payouts are triggered when pre-defined environmental parameters exceed thresholds. These parameters can be remotely sensed and monitored using satellite data, UAV imagery, or ground-based sensors.
Geospatial triggers play a pivotal role in parametric insurance by providing quantifiable data on:
Rainfall deviation
Vegetation health indices (NDVI, EVI)
Soil moisture levels
Flood or drought extents
Crop growth anomalies
When these indicators exceed critical thresholds across insured parcels, they automatically activate payouts, minimizing disputes and delays.
Components of Geospatial Trigger Systems
Remote Sensing Platforms Satellites: MODIS, Sentinel, Landsat, and commercial satellites (e.g., Planet, Maxar) provide optical and radar data at various spatial and temporal resolutions. Drones/UAVs: Offer high-resolution imagery for smallholder-focused programs. IoT Sensors: Ground-based weather stations and soil probes augment satellite data with hyperlocal precision.
Geospatial Analytics Engine Processes raw spatial data to extract relevant indicators. Computes loss signatures using AI/ML models trained on historical disaster and crop yield datasets. Integrates GIS layers like cadastral maps to correlate spatial data with farm boundaries and insurance units.
Trigger Design and Calibration Involves defining threshold values for parameters like rainfall (mm/day) or NDVI drop (% change). These thresholds are often region- and crop-specific. Calibration uses historical loss data to balance sensitivity (detecting real losses) and specificity (avoiding false triggers).
Insurance Management Interface Dashboards allow insurers and regulators to monitor trigger events in real time. Triggers can be audited, traced to specific satellite scenes, and verified using ground-truthing when needed.
Spatial Indicators and Use Cases
1. Drought Detection Using NDVI Trends
NDVI (Normalized Difference Vegetation Index) reflects vegetation health.
A significant drop compared to historical averages in the same phenological phase can indicate drought.
If 80% of plots in a taluka record NDVI deviation beyond -0.3, it can serve as a payout trigger.
2. Flood Mapping with SAR Imagery
Synthetic Aperture Radar (SAR) can penetrate cloud cover, essential for flood-prone regions.
Automated classification detects water inundation extents.
If more than 50% of a farm’s area is underwater for >3 consecutive days, the policy triggers.
3. Excess Rainfall Using Weather Raster Data
Rainfall accumulation maps derived from IMERG (NASA) or INSAT data can identify localized events.
Rainfall thresholds (e.g., >200 mm in 48 hours) are defined per crop susceptibility.
4. Crop Health Monitoring Using Time-Series NDVI
AI models compare seasonal NDVI profiles against known healthy growth patterns.
Anomalies (e.g., stunted growth curves) across geographies can indicate pest outbreaks or disease.
5. Soil Moisture Anomalies
Sentinel-1 and SMAP satellites offer soil moisture datasets.
Thresholds such as <10% volumetric soil water for more than two weeks can signal drought risk.
Technical Challenges in Implementation
Spatial Resolution vs. Field Size Many Indian smallholder farms are <1 ha, requiring <10 m resolution. While commercial imagery solves this, cost and access become limiting.
Cloud Cover in Optical Imagery During monsoon season, frequent cloud cover hinders visibility. Radar (e.g., Sentinel-1) and drone deployments offer workarounds.
Geolocation Accuracy of Farm Boundaries Inaccurate or missing cadastral maps lead to spatial misalignment. Use of GPS-based farmer registration and digital land records can improve boundary mapping.
Model Calibration and Local Relevance Universal thresholds do not work; agro-climatic zones need specific calibration. Historical yield, weather, and remote sensing archives are essential for local tuning.
Farmer Awareness and Trust Many farmers are unaware of geospatial triggers or skeptical of satellite-based decisions. Field campaigns, grievance redressal systems, and transparency dashboards are necessary for adoption.
Benefits of Geospatial Triggers in Agri-Insurance
Speed: Payouts can be processed within days of a trigger event, removing manual delay.
Transparency: Satellite scenes and analytics can be shared with farmers to justify decisions.
Scalability: Entire districts or states can be monitored without increasing operational manpower.
Cost-efficiency: Reduces need for physical surveys, lowering claim validation costs.
Risk Pooling: Helps insurers develop zonal risk models and price premiums more accurately.
India-Specific Initiatives and Frameworks
In India, the Pradhan Mantri Fasal Bima Yojana (PMFBY) has started integrating geospatial triggers through:
Crop Cutting Experiment (CCE) optimization using NDVI-based anomaly zones.
Digital CCE apps integrated with GPS and timestamped photos.
Collaboration with ISRO for high-frequency monitoring.
Pilot programs in states like Maharashtra and Karnataka using drone imagery and rainfall indices.
The National Remote Sensing Centre (NRSC) and Mahalanobis National Crop Forecast Centre (MNCFC) play key roles in data provisioning and analytics support.
Future Outlook
The evolution of geospatial-triggered insurance will depend on four key enablers:
Data Fusion: Integration of EO, IoT, and crowdsourced data for multi-source validation.
AI/ML Advancements: Better training of loss detection models using diverse crop-stage data.
Blockchain for Traceability: Ensuring transparent logging of every trigger and payout event.
Policy and Regulatory Support: Clear guidelines for trigger design, calibration, and redress mechanisms.
As climate risks intensify, automated and evidence-based insurance models powered by geospatial data will become essential for climate-resilient agriculture.
Conclusion
Geospatial triggers are redefining how agri-insurance functions, moving it from reactive compensation to proactive, timely risk management. By leveraging satellite data and spatial analytics, insurance payouts can now be executed fairly, faster, and at scale. For India and other agrarian economies, this model holds the promise of improving farmer resilience, reducing operational burdens on insurers, and strengthening the agri-fintech ecosystem.