India’s National One Health Mission aims to break data silos across human health, animal health, and the environment to strengthen epidemic intelligence and preparedness. A geospatial backbone is the simplest way to stitch these streams together because most health risks have a location, a time, and a context. The result: earlier warnings, sharper response, and better use of limited resources. The Mission is led through the Office of the Principal Scientific Adviser with cross-ministerial coordination; it complements long-running programs such as IDSP for human disease surveillance, NADRES/NADRS for animal disease risk, and ICMR’s AMR network.
Why geospatial is the “common layer”
1) Shared spatial frame – Village, ward, and facility polygons let us align records from IDSP/IHIP, veterinary labs, and environmental monitoring without forcing a single mega-database. The map becomes the join key.
2) Spatial epidemiology out of the box – Hotspot detection, scan statistics, nowcasting with spatial priors, and exposure modeling (e.g., proximity to wetlands or waste sites) are native to GIS and boost early detection.
3) Decision-ready views – Micro-plans for vector control, targeted AMR stewardship where resistant isolates cluster, and risk-weighted inspection routes for food and water safety all start from a map and end in an action list.
The Indian context: build on what exists
IDSP/IHIP (NCDC) already aggregates weekly S/P/L data from health workers, clinicians, and labs; geocoding those reports to consistent boundaries allows trend maps and anomaly detection by block and urban ward.
NADRES v2 (NIVEDI) provides AI-based livestock disease risk bulletins; linking those grids with human febrile syndromes can flag zoonotic crossover.
ICMR’s AMRSN tracks antimicrobial resistance across hospitals; mapping resistance phenotypes with pharmacy consumption and sanitation indicators helps target stewardship and WASH interventions.
Mission governance under the National One Health Mission (PSA/ICMR) gives the mandate for integrated, multi-sector analytics; pandemic preparedness investments under PM-ABHIM strengthen the digital and lab backbone.
A practical geospatial blueprint (One Health)
Ingest → Harmonize → Analyze → Act
1) Ingest
Human: IDSP/IHIP weekly feeds, hospital EHR exports, lab LIMS, claims (de-identified).
Animal: NADRES/NADRS events, state vet lab results, dairy cooperative screening. PMC
Environment & vectors: Remote sensing (rainfall, land cover, water bodies), meteorology, sanitation and water-quality sampling, entomology trap counts.
2) Harmonize
Standardize to common spatial units (village/ward, health facility catchments) and time bins (day/week).
Geocode and deduplicate using facility registries and census/LGD codes; attach contextual layers (flood zones, markets, transport).
Privacy & DPDP compliance: Use aggregation, k-anonymity thresholds, and data-use logging; keep personal data within source systems, move only aggregated indicators to the geospatial layer.
3) Analyze
Early warning: Spatial anomaly detection on syndromic indicators cross-checked with animal morbidity and rainfall deviations.
Hotspots: Kernel density and scan statistics for clusters of febrile illness + animal abortions + standing water.
AMR intelligence: Resistance heatmaps by organism–antibiotic pair linked to prescribing and sanitation.
Resource planning: Location-allocation for mobile labs, vector teams, and rapid response units.
4) Act (operational loops)
Auto-generated micro-plans with route optimization and time windows.
Risk-ranked panchayats/wards for IEC, vaccination, vector control, or sampling.
Measurable feedback: “days-to-detect,” “days-to-respond,” and “cases averted” at district/state levels.
Worked example
A coastal district sees: (a) a small rise in IDSP “S” fever reports, (b) NADRES risk bulletin for livestock hemorrhagic disease up two weeks prior, and (c) satellite-derived wetness anomalies after heavy rain. The fused map surfaces a medium-confidence alert for three adjacent blocks. The district triggers targeted animal sampling and household chlorination, and positions RRTs near bus depots and weekly markets. Lab confirmations arrive; the response starts days earlier than it would have with human signals alone. This is the core promise of One Health geospatial analytics, earlier, smaller, cheaper outbreaks.
Implementation checklist (90 days)
Data agreements with NCDC/IDSP, state AH departments, NIVEDI, and ICMR sites (aggregated indicators only).
Spatial reference : freeze boundaries (wards, blocks), facility registry, and sampling locations.
Pipelines : weekly batch for IDSP, monthly for AMR, monthly risk grids from NADRES, daily remote sensing.
Dashboards & alerts : district-level hotspot tiles, AMR heatmaps, and SMS/WhatsApp alerts with map links.
Ops integration : export micro-plans (routes, work orders) to field apps; log action dates to measure “detect→respond” time.
Governance : data-quality playbook, access roles, and audit trails.
Benefits & ROI (what administrators can expect)
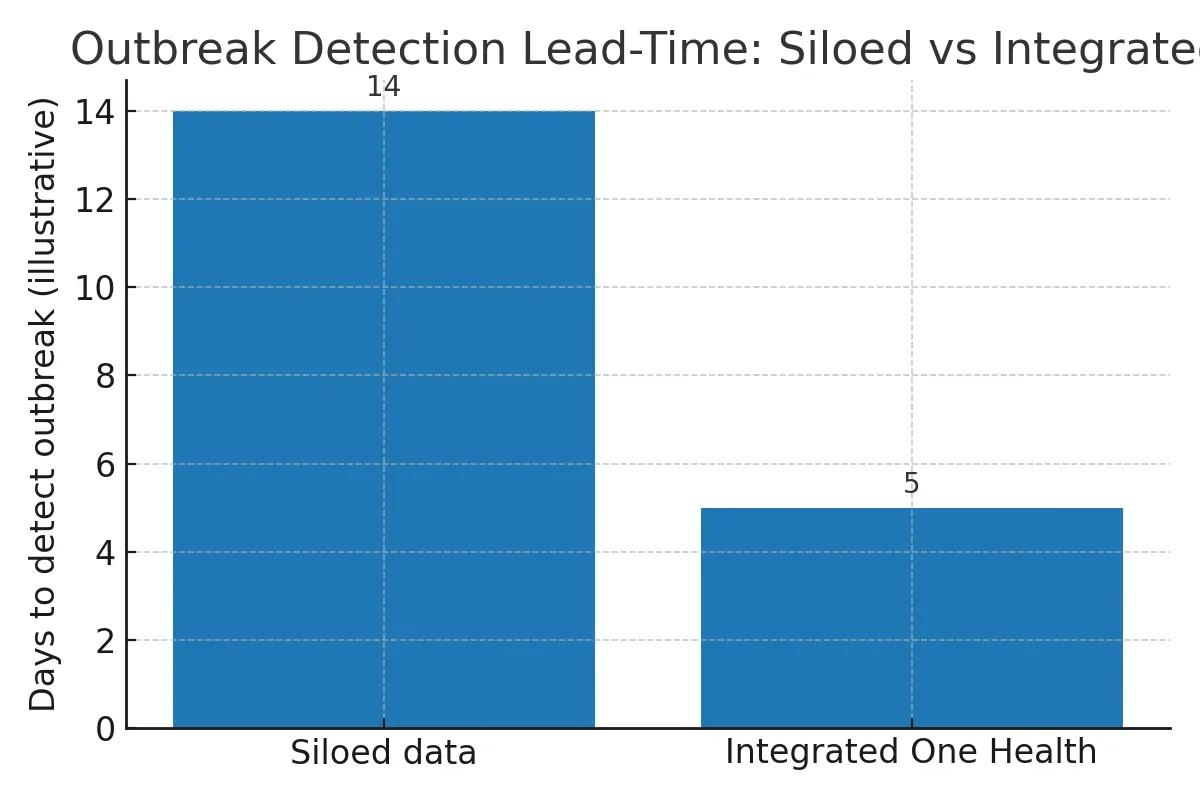
Earlier detection (measured by Figure 1’s “days to detect”).
Fewer false alarms by corroborating across domains.
Targeted spending : prioritize high-risk blocks/wards and facilities.
Better AMR stewardship where resistance and prescribing pressure intersect.
Stronger preparedness aligned with PM-ABHIM investments and Mission governance.
Conclusion
India already runs strong surveillance programs in each domain. The next step is not a new system, but a geospatial stitch that connects them, preserves privacy, and drives action in districts and cities. With a small set of feeds, stable spatial boundaries, and clear KPIs, states can operationalize One Health quickly and learn faster with each season. That is how geospatial turns One Health from a slogan into a working early-warning machine.
Note: Charts are illustrative to show structure and KPIs; plug in your state’s real feeds and baselines.