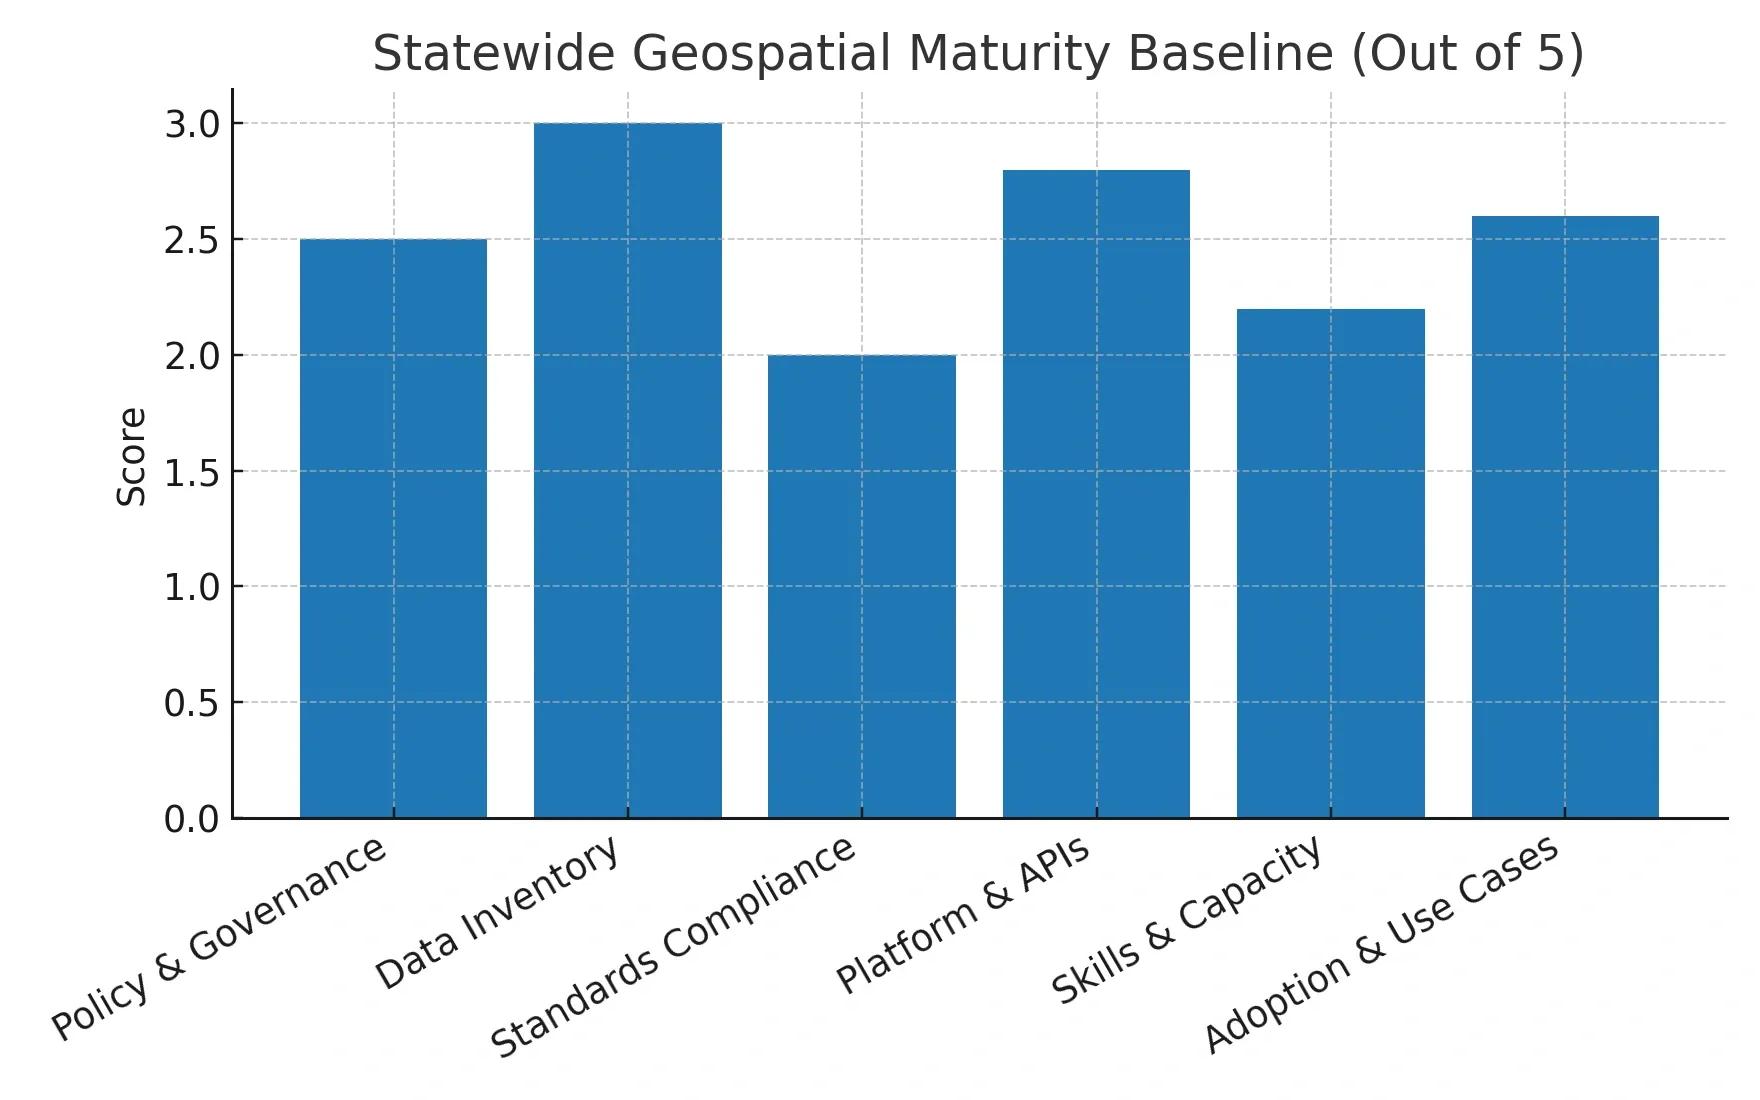
Most state departments already use maps, but they use them separately. Land records, urban permits, utilities, transport, health, and disaster teams each maintain their own datasets, standards, and tools. The outcome is predictable: duplicated spend, inconsistent decisions, and slow delivery. A state-level geospatial governance model fixes this by making location a shared utility, one authoritative base map, common registries (land, address, assets), and API-first access for every program.
This model aligns with India’s digital push, National Geospatial Policy (2022), the DPDP Act (2023), and state e-governance missions. It defines clear ownership (a Geospatial Governance Council and PMU), adopts open standards (OGC APIs, ISO metadata), and runs on a State SDI that publishes secure, measurable services. The goal is simple and testable: shorter permit cycles, fewer utility strikes, faster disaster response, better revenue coverage, and lower unit costs across departments.
The problem: islands of excellence, not a system
Fragmented projects: each department builds its own datasets and apps.
No single authoritative base map or registry (parcels, addresses, roads, utilities).
Limited API standards and metadata; weak data sharing agreements.
Procurement focuses on point solutions, not platforms.
Skill gaps and uneven adoption at district/ULB levels.
Result: duplication, inconsistent decisions, slow time-to-value.
The model: five-layer geospatial governance for smart states
1) Strategy & Outcomes
Define why geospatial exists: service quality, compliance, and savings. Link outcomes to clear KPIs, permit cycle time, disaster response time, asset uptime, revenue leakage reduction.
2) Geospatial Governance Council (GGC)
Chair: Chief Secretary / IT Secretary.
Members: line departments (Revenue, Urban, Rural, Transport, Energy, Health, Agriculture, Disaster, Environment), finance, legal, and data protection officers.
Program Management Unit (PMU): day-to-day delivery, standards adoption, vendor coordination, and benefits tracking.
Working Groups: Base Maps & Registries, Standards & APIs, Data Protection & Security, Use-Case Accelerators.
3) Data & Standards
Authoritative base layers : state base map, cadastral/land parcels, address registry, road/rail/water networks, utilities, administrative boundaries.
Registries as shared truth: land, addresses, institutions, assets.
Standards : OGC APIs, ISO metadata, Indian datum/CRS, interoperability with ABAC/identity services; DPDP-compliant data handling.
Lifecycle : capture → QA/QC → catalog → publish → govern access → archive.
4) Platforms & Integration
State Spatial Data Infrastructure (SDI) : catalog, tiles, feature services, analytics, event streams.
API Gateway for external and inter-departmental consumption.
Identity & Access : role-based, attribute-based, consent artifacts.
Observability : usage telemetry, cost tags, performance SLOs.
5) Programs & Adoption
Priority domains: Urban planning & permits, Land administration, Utilities & infrastructure, Transport & logistics, Disaster risk & climate resilience, Health & One Health, Agriculture.
Playbooks: reference datasets + starter dashboards + KPIs per domain.
District enablement: templates, training, help desk, outcome-based grants.
Implementation blueprint (12–24 months)
Phase 0 – Discover (30–60 days)
Baseline maturity (policy, data, tech, people, use cases).
Inventory datasets; identify authoritative sources.
Define 6–8 outcome KPIs and business case per domain.
Phase 1 – Foundation (Quarter 1–2)
Constitute GGC + PMU and working groups.
Stand up State SDI (catalog, OGC APIs, base map).
Launch Land & Address registries with data quality rules.
Publish data-sharing and privacy policies; DPDP controls.
Phase 2 – First Wave (Quarter 3–4)
Ship 3 “lighthouse” use cases (e.g., e-permit map services, disaster asset visibility, utilities dig-safe one-call).
Instrument telemetry + cost tags for value accounting.
Phase 3 – Scale (Year 2)
Expand to 8–10 departments; enforce API-first procurement.
District rollout kit; performance-linked grants.
Annual state geospatial report with KPI impacts and savings.
Operating model and roles
Owner: IT/E-Gov Dept with Revenue/Survey & Land Records as co-owner for base layers.
PMU: product leads (SDI, registries, domain solutions), data governance lead, security lead, SRE/DevOps, procurement specialist, training/enablement.
Vendors/Partners: platform integrator + data partners (UAV/EO/LiDAR) + domain ISVs.
Procurement shift: from monolithic projects to product/platform contracts with SLOs, modular work orders, and success-based milestones.
Data governance and privacy by design
Minimize & protect: collect only required attributes; mask/aggregate for public layers.
Role/consent based access: ABAC, consent logs, audit trails.
Risk tiers: open data (non-sensitive), restricted (internal), sensitive (PII/critical infra).
Quality SLAs: freshness, positional accuracy, topology, lineage.
Funding and value accounting
Pool department budgets for base map/registries (shared goods).
Domain teams fund apps built on the SDI.
Track benefits: revenue capture (property tax, stamp duty), cost avoidance (reworks, utility strikes), service levels (permit time), and resilience (downtime avoided).
Metrics that matter (example KPIs)
90% permits processed with automated spatial rules.
50% reduction in utility damages via dig-safe checks.
30% faster disaster response through asset & shelter visibility.
10–20% increase in property tax coverage via parcel-address reconciliation.
>95% uptime for SDI services; <24h for critical dataset refresh.
Quick example: a “Smart State” journey
Urban permits: zoning/heritage/buffer checks via API, reducing approvals from 21 to 7 days.
Land transparency: parcel-owner-address reconciliation cuts disputes and raises collections.
RoadWorks-as-a-Service: one-map coordination across utilities trims rework and public disruption.
Flood readiness: shared risk layers + simulation dashboards improve evacuation planning.
Benefits & ROI (in brief)
One shared truth → consistent decisions.
Faster delivery → shorter citizen wait times.
Lower duplication → better unit costs.
Transparent, auditable data flows → compliance and trust.
Scalable platform → new use cases come online faster.
Conclusion
Geospatial governance turns scattered projects into a system. By linking strategy and KPIs to data standards, platforms, and domain programs, states get one source of spatial truth and a repeatable way to deliver outcomes. The operating shift is practical: API-first procurement, authoritative registries, privacy-by-design access controls, and value accounting that proves savings and service gains quarter by quarter.
The path to action is clear. In 90 days, constitute the council and PMU, inventory critical datasets, stand up a minimum SDI (catalog + OGC APIs + base map), and launch three lighthouse use cases with telemetry. In 12–24 months, scale to districts and additional departments with performance-linked grants. States that do this won’t just map their assets, they’ll govern with them, using shared spatial infrastructure to plan better, respond faster, and spend smarter.
Note: The visuals and examples presented in this article are illustrative.