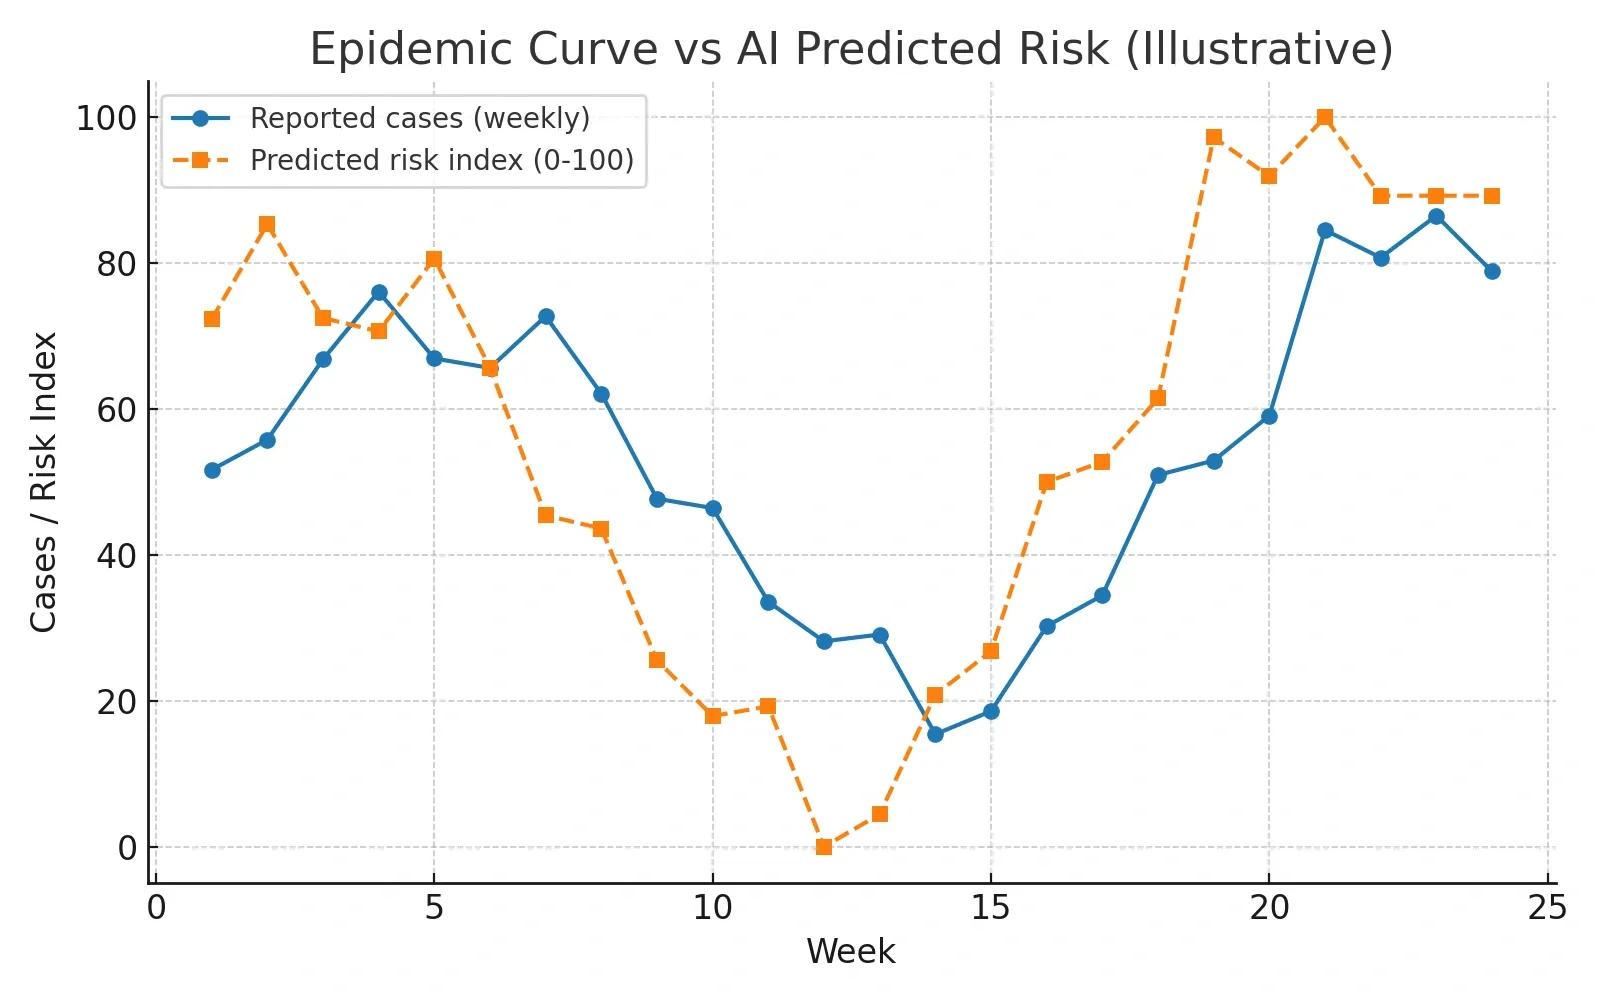
Why it matters (India + global): With dense urbanization, climate-sensitive vectors, and fast mobility networks, outbreaks spread along spatial pathways, not just timelines. Geospatial epidemiology uses AI to detect these spatial–temporal patterns early so public health teams can act faster and more precisely.
What geospatial epidemiology + AI actually does
Fuses heterogeneous data : case and syndromic feeds, mobility and weather, wastewater, satellite imagery, demographics, pharmacy sales.
Learns spatial–temporal signals : clustering, spillover across adjacent areas, lags between mobility and case growth, climate–vector cycles.
Generates operational outputs : ward-level risk maps, hotspot alerts, resource plans (testing kits, vector-control teams), and scenario simulations.
“Would you tolerate a few false alarms if it gives you a 5–10 day head start on interventions?”
The data stack (and governance)
Core inputs : geocoded cases, lab confirmations, syndromic signals from clinics/telemedicine, pharmacy sales, Google/telecom mobility aggregates, rainfall/temperature, land use, water bodies, and wastewater viral loads.
Granularity : grids (e.g., 1 km), wards, or health sub-centers; choose one resolution and stick to it for stable operations.
Privacy & compliance : aggregate or anonymize person-level data; minimize data retention; apply role-based access and audit trails. In India, align with the Digital Personal Data Protection Act (2023) in addition to sector-specific rules.
Quality control : continuous deduplication, under-reporting checks, delay-adjusted nowcasting, and imputation for missing geocodes.
Methods that work in practice
Exploratory spatial analysis : Moran’s I, Getis–Ord hotspots, spatial lags (neighborhood effects), kernel density surfaces.
Forecasting & early warning:
Tree-based : gradient boosting (e.g., XGBoost) for tabular features (mobility, weather, lagged cases, spatial lags).
Sequence models : LSTM/Temporal CNNs for time patterns.
Graph models : Graph Neural Networks capturing spread along adjacency (wards, transit links).
Bayesian hierarchical : handles partial data and uncertainty well; gives credible intervals for action thresholds.
Change-point detection : flags regime shifts, e.g., sudden vector bloom after heavy rain.
Decision logic : turn model scores into actionable thresholds (e.g., top 10% risk cells trigger inspections; top 5% trigger vector control + community messaging).
A reliable workflow (from raw feeds to action)
Ingest & clean → standardize formats, geocode, handle duplicates, compute lagged/rolling features.
Feature engineering → spatial lags, mobility-derived import risk, rainfall anomalies, vegetation/water indices, housing density.
Model training → k-fold by geography (to reduce leakage), calibration, and backtesting with realistic reporting delays.
Scoring & alerting → risk score per cell/ward, uncertainty bands, thresholds tied to ops capacity.
Ops loop → assign crews, log outcomes (larval counts, tests, cases prevented proxies), feed back into model for continuous learning.
MLOps & governance → model registry, drift detection, versioned datasets, transparent playbooks.
Example: Early dengue warnings for a large Indian city
Setup : 1 km grid, three years of weekly cases, rainfall and temperature, satellite-derived water/vegetation indices, and anonymized mobility aggregates.
Model : GNN + XGBoost ensemble produces a 7-day lead risk map with uncertainty.
Action : Top decile cells get preemptive vector control and community messaging; clinics in adjacent cells get targeted testing guidance.
Outcome (illustrative): Operations are scheduled earlier, with higher positivity yield in targeted tests and better crew utilization. The system is reviewed weekly, thresholds adjusted during monsoon peaks.
Trade-offs and how to manage them
Lead time vs precision : earlier alerts can be noisier. Use tiered actions, light-touch messaging for medium risk, resource-intensive interventions for high risk.
Under-reporting : blend syndromic and wastewater signals; use nowcasting to correct reporting delays.
Bias & equity : watch for uneven testing access; compare risk scoring against socio-economic indicators; include domain review before high-impact decisions.
Model drift : mosquito behavior, human mobility, and reporting practices change, track drift and retrain on a cadence (e.g., monthly, and post-monsoon).
Benefits & ROI (fast take)
Faster response with days of lead time.
Targeted deployments → fewer truck rolls, better hit rates.
Capacity planning for beds, oxygen, and staff during surges.
Transparent communication with uncertainty ranges.
Scalable playbooks that transfer across districts and diseases.
Getting started (minimal viable stack)
Data : case line list (geocoded), rainfall/temp, mobility aggregates, satellite layers, optional wastewater.
Tools : QGIS/ArcGIS for layers; PostGIS/BigQuery for storage; Python (xgboost, pytorch), Airflow for pipelines; dashboards in Power BI/Metabase; tiled web maps (Mapbox/Cesium); alerting via SMS/WhatsApp gateways.
Governance : DPDP-aligned policies, DPO oversight, red-team reviews for re-identification risks.
The road ahead: One Health by design
Outbreaks often sit at the interface of human–animal–environment systems. Future-ready programs unify health surveillance with climate, land use, and livestock data, so public health doesn’t chase the curve, it shapes it.
Note: The visuals and examples presented in this article are illustrative.