GeoAI, AI applied to geospatial data, has matured fast. Paired with cloud platforms, it is redefining how we ingest drone imagery, detect anomalies, and produce large-scale maps for city and infrastructure planning. This article breaks down the end-to-end stack and shows why cloud-native GeoAI is becoming the default choice for urban planners, utilities, and infrastructure operators, especially in fast-growing markets like India.
Why this shift is happening now
Exploding data volumes: UAVs, mobile mapping, and IoT sensors generate terabytes per campaign. Desktop workflows choke at this scale.
Model-driven analysis: Pre-trained and fine-tuned models for object detection, change detection, and segmentation cut manual effort drastically.
Cloud economics: Elastic compute, GPU pools, and serverless pipelines lower time-to-insight and improve unit economics.
Governance requirements: With India’s DPDP Act and sector norms, cloud platforms provide traceability, access controls, and audit trails out of the box.
The cloud-native GeoAI pipeline (simple view)
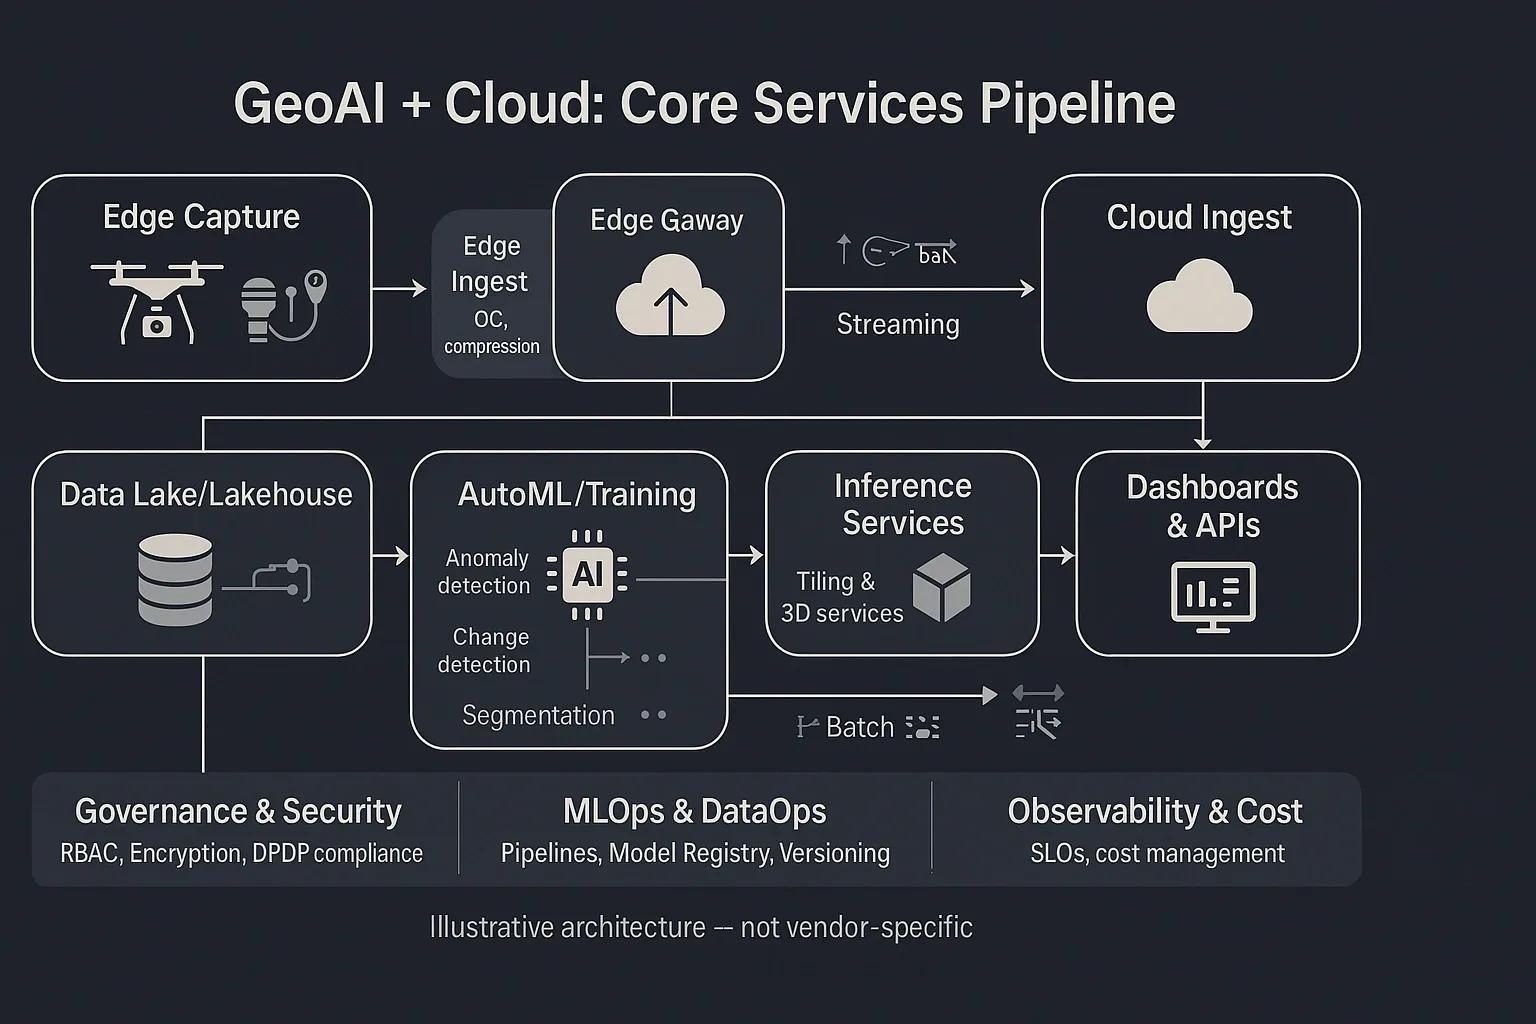
Capture & Edge Prep : UAV collects imagery; basic QC/compression at the edge gateway.
Ingest & Storage : Secure upload to a data lake/lakehouse; auto-cataloging of imagery, LiDAR, and vector layers.
Training/AutoML : Prepare tiles/patches, labels, and embeddings; train or fine-tune models for tasks like rooftop detection or crack segmentation.
Inference & Tiling : Batch or streaming inference; generate detections, semantic masks; serve as 2D/3D tiles.
Delivery : Dashboards, APIs, and notifications integrate with planning systems (BIM, CMMS, asset registries).
Ops Layer : MLOps/DataOps for versioning and rollbacks; observability and cost controls; policy and access management.
What improves with GeoAI + Cloud
Cycle time: From flight to feature extraction in hours.
Consistency: Standardized pipelines beat one-off scripts and manual processes.
Scale: Elastic compute handles nationwide mapping, not just single projects.
Interoperability: APIs feed municipal, utility, and infrastructure systems without file-handling mess.
Governance: Built-in lineage, audit, and role-based access simplify compliance.
Key capabilities transforming planning & ops
1) Drone data management at scale
Automated tiling & pyramids for fast visualization across zoom levels.
Metadata extraction (EXIF, flight logs) auto-links missions, sensors, and AOIs.
Policy-based storage (hot/warm/cold tiers) reduces cost without losing access to historical baselines.
2) Anomaly and change detection
Pre-built detectors for potholes, encroachments, cracks, vegetation overgrowth, and safety hazards.
Change maps highlight deltas between time-stamped surveys, perfect for construction progress, road health, or encroachment monitoring.
Active learning loops : operators correct edge cases; the model improves weekly.
Quick check: Would you adopt automated change detection now, or wait for 100% model certainty?
3) Large-scale mapping for smart cities
Tile services support city dashboards and open APIs.
3D meshes and point clouds aid visibility studies, flood modeling, and utilities planning.
Authoritative registries (addresses, parcels, utilities) synchronize with GeoAI outputs to keep digital twins current.
Practical example: Ward-level road maintenance (Indian city)
Problem:
A municipal corporation needs quarterly condition surveys of 2,000 km of urban roads. Manual inspections are slow and inconsistent.
Solution approach:
UAV missions run per ward; imagery streams to the cloud the same day.
GeoAI model segments road surface; detects cracks, potholes, and patch failures.
Change detection compares against previous quarter.
Results published as ward-level tiles and a prioritized worklist (severity × traffic).
API pushes work orders into the contractor’s app; completion updates flow back to dashboards.
Outcome:
Survey-to-worklist time drops from 3–4 weeks to <72 hours.
30–40% fewer site revisits; unit cost per inspected km falls.
Transparent prioritization improves citizen satisfaction and audit readiness.
Architecture choices that matter
Data lakehouse over ad hoc storage: Unified tables + object storage simplify joining imagery, vectors, and labels.
Vector database / feature store for embeddings: Speeds up similarity search, weak labeling, and model reuse.
Event-driven pipelines (serverless): Triggered by new uploads or AOI changes; no cron sprawl.
Model registry + inference gateways: Versioned models with rollback; scale-to-zero inference endpoints.
Policy & privacy by design: RBAC/ABAC, encryption, and retention rules aligned to Indian DPDP requirements.
What to measure (so you know it’s working)
Lead time: flight → published detections (hours).
Precision/recall: per class (e.g., pothole, vegetation).
Coverage: km²/day processed; % AOI refreshed monthly.
Cost per km²: all-in processing + storage.
Adoption: API calls, active users, and successful work orders.
Reliability: pipeline success rate; SLA/SLO adherence.
Benefits & ROI (at a glance)
Faster planning cycles and fewer site visits.
Lower cost per mapped km² at higher refresh frequency.
Better asset life through earlier anomaly detection.
Consistent data model feeding BIM/CMMS/GIS without format chaos.
Compliance and audit readiness built into the stack.
Conclusion
GeoAI on cloud is not a niche add-on; it is the new standard for geospatial analysis. Cities, utilities, and infrastructure operators that adopt a cloud-native stack move faster, spend less, and make fewer mistakes. For India’s next hundred cities and for large private operators, this approach creates a durable digital backbone, one that turns raw drone pixels into decisions that matter.