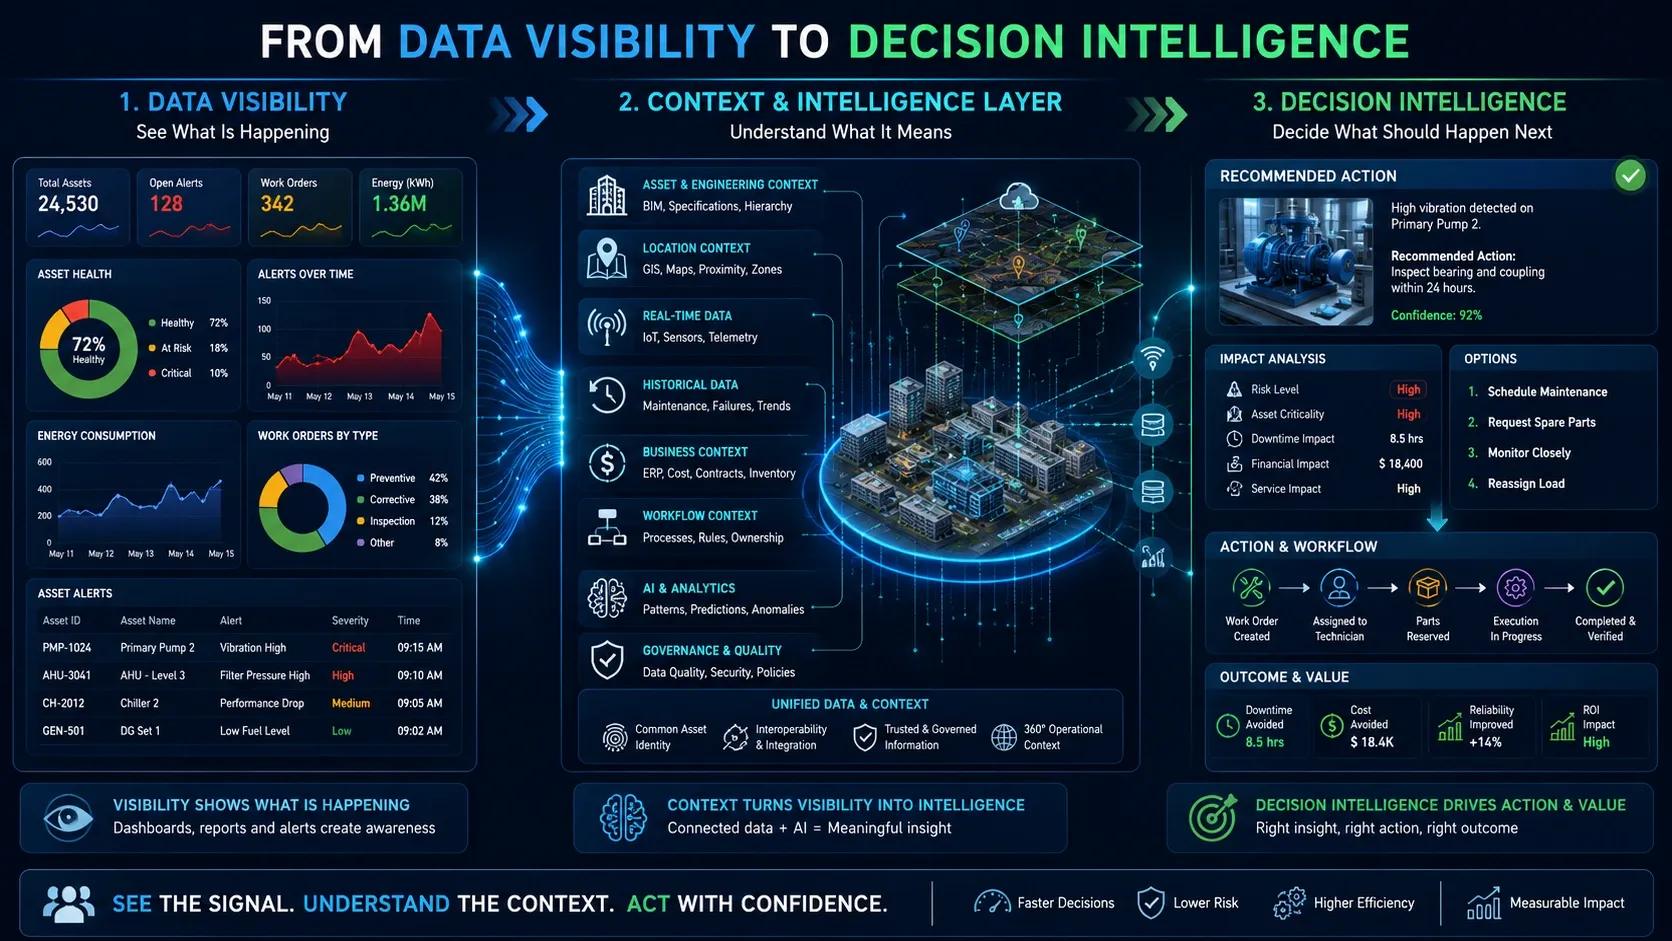
For many years, digital transformation has focused on making data visible.
Organizations built dashboards.
They digitized records.
They deployed sensors.
They created reports.
They developed analytics platforms.
They connected some systems.
They invested in Digital Twins and AI pilots.
This improved visibility.
Teams could see more than before. Leaders could monitor KPIs. Managers could track performance. Operations teams could observe assets, alerts, trends, and exceptions.
But visibility is not the final goal.
The real question is:
Can the organization make better decisions because of the data it sees?
This is where the next enterprise shift begins.
The future is not just data visibility.
It is decision intelligence.
Data Visibility Was an Important Step
Data visibility solved an important problem.
Earlier, information was often hidden in files, spreadsheets, emails, departments, paper records, and legacy systems.
Leaders had to depend on delayed reports.
Operations teams had to search across systems.
Field updates arrived late.
Asset records were incomplete.
Project status was manually compiled.
Maintenance insights were fragmented.
Business performance was reviewed after the fact.
Dashboards and digital systems improved this.
They made information easier to access.
They helped organizations understand what was happening across operations.
This was a necessary phase.
But many organizations are now discovering that visibility alone does not automatically create value.
Seeing more data does not always mean making better decisions.
The Visibility Trap
A common mistake in digital transformation is assuming that if data is visible, decisions will improve.
That is not always true.
A dashboard may show that energy consumption is rising.
But it may not explain why.
A sensor may show that an asset is under stress.
But it may not show the maintenance priority.
A GIS map may show where an issue is located.
But it may not show business impact.
A BIM model may show the asset structure.
But it may not show live condition.
An ERP system may show cost data.
But it may not show operational risk.
A Digital Twin may show a 3D environment.
But it may not support action.
This is the visibility trap.
Organizations see more information, but still rely on people to interpret it manually, coordinate across departments, and decide what happens next.
The result is more dashboards, more alerts, more reports, and still slow decision-making.
Why Visibility Alone Is Not Enough
Operations require more than information.
They require interpretation, prioritization, ownership, and action.
A useful decision-support system should help answer:
What is happening?
Where is it happening?
Why is it happening?
What may happen next?
How serious is it?
Who is affected?
What action should be taken?
Who should act?
What value will the action create?
How will the outcome be measured?
Most dashboards answer only the first question.
Sometimes they answer the second.
But decision intelligence requires the full chain.
It is not enough to know that an issue exists.
The organization must know what to do about it.
What Is Decision Intelligence?
Decision intelligence is the ability to connect data, context, analytics, workflows, governance, and human judgment to support better decisions.
It goes beyond visualizing information.
It helps convert data into action.
Decision intelligence connects:
data from multiple systems,
asset and engineering context,
geospatial context,
real-time signals,
historical records,
business impact,
AI and analytics,
workflow ownership,
recommended actions,
measurable outcomes.
The goal is not only to report performance.
The goal is to improve decisions.
This is the next level of enterprise intelligence.
Data Visibility Answers “What?”
Data visibility helps answer:
What happened?
What is happening?
What changed?
What is the current status?
What is the trend?
These questions are useful.
But they are not enough for operational action.
For example, a dashboard may show:
Asset health has dropped.
Energy use has increased.
A project milestone is delayed.
A road defect has been detected.
A flood-prone zone is under stress.
A utility outage has occurred.
A warehouse process is slowing down.
This creates awareness.
But awareness does not automatically create action.
Decision Intelligence Answers “So What” and “Now What?”
Decision intelligence goes further.
It helps answer:
So what does this mean?
Why does it matter?
What is the risk?
What is the priority?
What are the options?
What action should be taken now?
What happens if we delay?
What outcome should we expect?
How do we measure value?
This is the shift from visibility to intelligence.
For example:
Instead of only showing that an asset health score has declined, decision intelligence can show that the asset is critical, located in a high-impact area, has a recurring failure pattern, supports a high-value process, and should be inspected within 48 hours.
Instead of only showing that road defects exist, decision intelligence can prioritize them based on severity, traffic volume, safety risk, location, drainage, maintenance history, and budget.
Instead of only showing energy consumption, decision intelligence can recommend changes based on occupancy, weather, tariff, equipment condition, and comfort requirements.
This is where data becomes useful.
Context Is the Bridge
The bridge between data visibility and decision intelligence is context.
Data without context is difficult to act on.
A number needs context.
A location needs context.
An alert needs context.
A trend needs context.
A model output needs context.
Context helps explain meaning.
It can include:
asset context,
spatial context,
engineering context,
operational context,
workflow context,
business context,
governance context.
For AI-ready operations, context is essential.
AI may detect a pattern, but context explains whether that pattern is important, urgent, risky, actionable, or valuable.
This is why Digital Twins, GIS, BIM, IoT, ERP, CMMS, and workflow systems need to converge.
They provide the context required for better decisions.
The Role of Digital Twins
Digital Twins can play an important role in moving from visibility to decision intelligence.
But only if they are designed correctly.
A Digital Twin should not be limited to 3D visualization.
It should help organize operational context.
It should connect:
physical assets,
BIM and engineering data,
GIS and location intelligence,
IoT sensor signals,
maintenance history,
ERP and cost data,
workflows,
AI models,
dashboards,
simulations,
decision logic.
When these layers are connected, the Digital Twin becomes more than a visual model.
It becomes a decision-support environment.
It can help teams understand what is happening, why it matters, what may happen next, and what action should follow.
The Role of AI
AI can accelerate the move from visibility to decision intelligence.
It can identify patterns faster than humans.
It can detect anomalies.
It can forecast risks.
It can classify images.
It can recommend actions.
It can summarize complex data.
It can support planning and optimization.
But AI cannot create decision intelligence on its own.
AI needs the right context, data quality, workflows, and governance.
Without these foundations, AI may generate alerts without action.
With these foundations, AI can support decisions.
For example:
AI can detect a likely failure.
Context can show asset criticality.
GIS can show service area impact.
BIM can show engineering relationships.
ERP can show cost exposure.
CMMS can trigger a work order.
Human oversight can approve action.
The organization can measure outcome.
That is decision intelligence.
From Dashboards to Decision Workflows
A key sign of maturity is the shift from dashboard-based monitoring to decision workflows.
A dashboard displays information.
A decision workflow defines what happens next.
For example:
If a risk score crosses a threshold, who is notified?
If a sensor anomaly is detected, how is it validated?
If an asset is critical, what priority is assigned?
If a field team is needed, how is the task routed?
If a work order is created, how is completion tracked?
If value is delivered, how is ROI measured?
Without workflows, insights remain passive.
With workflows, insights become action.
This is one of the biggest differences between data visibility and decision intelligence.
Decision Intelligence Requires Ownership
Technology alone cannot create decision intelligence.
Ownership is essential.
Every decision-support system must define:
Who owns the data?
Who owns the asset?
Who owns the workflow?
Who receives the insight?
Who validates the recommendation?
Who takes action?
Who measures outcome?
Who is accountable for improvement?
Without ownership, even the best dashboards and AI models can fail.
Decision intelligence requires organizational alignment.
It is not only a technical architecture.
It is also an operating model.
Governance Builds Trust
Trust is another foundation of decision intelligence.
Teams will not act on data they do not trust.
They will not rely on AI outputs they cannot explain.
They will not use dashboards that conflict with field reality.
They will not follow recommendations if accountability is unclear.
Governance helps build trust.
It defines data quality, ownership, access control, cybersecurity, update cycles, validation methods, model accountability, and human oversight.
Governance ensures that decision intelligence is not just fast.
It is reliable, responsible, and sustainable.
Measuring Decision Intelligence
Decision intelligence should be measured by outcomes, not only by system usage.
Useful metrics may include:
faster decision cycles,
reduced downtime,
improved response time,
lower maintenance cost,
better energy performance,
reduced rework,
improved safety,
higher asset utilization,
better service reliability,
lower risk exposure,
improved user adoption,
measurable ROI.
The goal is not to prove that data is visible.
The goal is to prove that better decisions are being made.
This is why outcome measurement should be built into the initiative from the beginning.
Sector Examples
In manufacturing, data visibility may show machine downtime, production delays, energy use, and quality issues. Decision intelligence connects machine condition, maintenance history, production schedules, quality data, spare availability, and cost impact to recommend the right action.
In buildings and campuses, visibility may show energy consumption, occupancy, comfort complaints, and equipment status. Decision intelligence connects HVAC performance, occupancy patterns, weather, asset condition, control logic, and tariff impact to optimize operations.
In utilities, visibility may show outage status, asset alarms, work orders, and network maps. Decision intelligence connects asset condition, GIS topology, customer impact, crew availability, regulatory priorities, and restoration plans.
In construction, visibility may show schedule progress, cost variance, site photos, and BIM models. Decision intelligence connects design intent, procurement, site progress, workforce, safety, rework risk, and financial exposure.
In roads and infrastructure, visibility may show pavement defects, inspection results, traffic data, and maintenance backlog. Decision intelligence connects location, road hierarchy, traffic, safety risk, drainage, cost, and prioritization logic.
In smart cities, visibility may show traffic, flooding, air quality, complaints, emergency incidents, and public assets. Decision intelligence connects spatial risk, vulnerable zones, response workflows, service impact, and agency coordination.
Across all sectors, the shift is the same.
From seeing data to using data for decisions.
What Enterprises Should Ask
To move from data visibility to decision intelligence, organizations should ask:
Which decisions are currently slow, manual, or unclear?
Which dashboards are only reporting information but not driving action?
What context is missing from current data?
Which systems need to be connected?
Are asset IDs, locations, and workflows aligned?
Can AI outputs be explained and trusted?
Who owns the decision and the action?
What workflow should follow an insight?
How will outcomes be measured?
What is the first use case where decision intelligence can be tested?
These questions help shift the discussion from technology deployment to decision improvement.
The Maturity Path
The journey from data visibility to decision intelligence can be seen in stages.
Level 1: Data Collection
Information is captured but often remains scattered.
Level 2: Data Visibility
Dashboards and reports make data easier to see.
Level 3: Connected Context
Data is linked with assets, location, workflows, and history.
Level 4: Predictive Intelligence
AI and analytics forecast risks, performance, and future conditions.
Level 5: Decision Intelligence
Insights are connected to recommended actions, ownership, workflows, and measurable outcomes.
Level 6: Intelligent Operations
Routine decisions become partially automated under governance and human oversight.
Many organizations have reached Level 2.
Some are moving toward Level 3.
The next competitive advantage will come from reaching Level 5.
Closing Thought
Data visibility was an important milestone in digital transformation.
It helped organizations see.
But enterprise value does not come from visibility alone.
Value comes when data improves decisions.
Decision intelligence is the next shift.
It connects data, context, AI, workflows, governance, and human judgment into one operating capability.
The future enterprise will not be defined by how many dashboards it has.
It will be defined by how quickly and confidently it can turn trusted information into measurable action.
Because in operations, seeing the problem is only the beginning.
The real value comes from knowing what to do next.