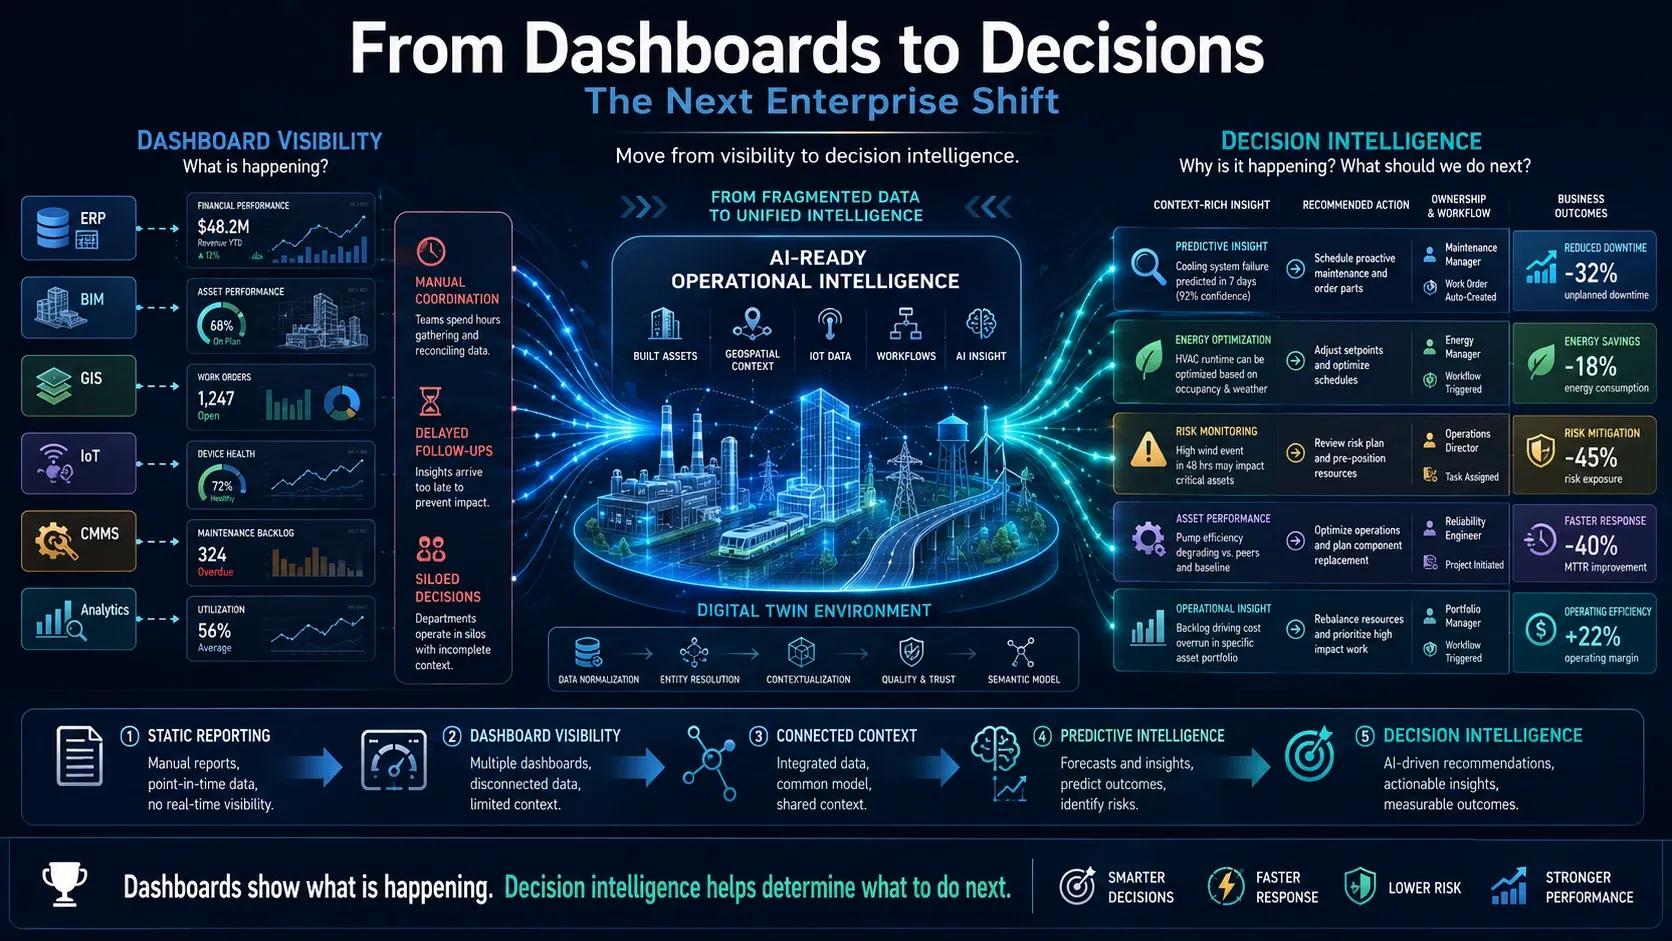
For many years, dashboards have been seen as a symbol of digital transformation.
They brought data onto screens.
They made performance visible.
They helped leaders track KPIs.
They gave teams a better view of operations.
In many organizations, dashboards replaced static reports, manual summaries, and delayed Excel updates.
That was an important step.
But now enterprises are facing a new challenge.
Visibility is no longer enough.
A dashboard may show that something is happening. But it may not explain why it is happening, what will happen next, what action should be taken, who should act, and what value the action will create.
This is where the next enterprise shift begins.
The future is not only about dashboards.
It is about decisions.
The Dashboard Era Improved Visibility
Dashboards solved a real problem.
Earlier, operational data was often locked inside departments, spreadsheets, reports, emails, and legacy systems. Leaders had to wait for periodic updates. Teams spent time preparing reports instead of acting on insights.
Dashboards changed that.
They helped organizations monitor:
asset performance,
project progress,
energy consumption,
maintenance status,
production output,
safety incidents,
field operations,
inventory movement,
financial KPIs,
customer service metrics.
This improved transparency.
For many organizations, dashboards created the first layer of digital awareness.
They helped people see what was happening.
But seeing is only the beginning.
The Limitation of Dashboards
A dashboard usually answers one question:
What is happening?
But enterprise operations require more than that.
They need to answer:
Why is it happening?
Where is the impact?
How serious is the issue?
What are the possible options?
Which action should be prioritized?
Who should act?
What will be the outcome?
How will value be measured?
This is where many dashboards fall short.
They present information, but they do not always connect that information to decisions and workflows.
A maintenance dashboard may show increasing equipment vibration.
But it may not show the asset’s criticality, maintenance history, spare availability, downtime cost, production impact, and recommended action.
A construction dashboard may show schedule delay.
But it may not connect the delay with design changes, material availability, site constraints, labour productivity, and downstream cost impact.
A city operations dashboard may show flooding in one area.
But it may not connect rainfall intensity, drainage capacity, terrain, road closures, emergency response routes, and citizen impact.
When dashboards stop at visibility, people still carry the burden of interpretation.
The Hidden Work Behind Dashboard-Based Decisions
In many organizations, a dashboard is only the starting point of decision-making.
A manager sees an issue on the dashboard.
Then the team starts checking other systems.
Someone verifies the asset record.
Someone checks maintenance history.
Someone opens the GIS layer.
Someone reviews the BIM model.
Someone asks for the latest site update.
Someone calls the field team.
Someone checks cost impact.
Someone prepares a summary.
Then a decision is made.
This process is common.
It is also slow.
The dashboard shows the signal, but the decision still depends on manual coordination.
This creates delays, repeated follow-ups, inconsistent interpretation, and different versions of truth.
In high-value operations, this delay can be costly.
For a factory, it may mean downtime.
For a road agency, it may mean delayed maintenance.
For a utility, it may mean slower outage response.
For a construction project, it may mean rework and cost escalation.
For a port, it may mean operational congestion.
For a smart city, it may mean poor emergency response.
The issue is not that dashboards are useless.
The issue is that dashboards are not enough.
The Next Shift: Decision Intelligence
Enterprises now need to move from dashboard visibility to decision intelligence.
Decision intelligence means connecting data, context, analytics, workflows, and human judgment so that teams can make better decisions faster.
It is not only about displaying KPIs.
It is about supporting action.
A decision-ready system should help teams understand:
what happened,
why it happened,
where it matters,
what may happen next,
what options are available,
what action is recommended,
who should act,
what impact should be measured.
This is the shift from reporting to reasoning.
Dashboards tell teams what they are seeing.
Decision intelligence helps teams decide what to do.
Why AI Needs This Shift
Many organizations are now exploring AI for operations.
They want predictive maintenance, anomaly detection, automated alerts, risk scoring, resource optimization, energy intelligence, and AI-assisted decision-making.
But AI cannot deliver strong value if it is connected only to dashboard-level data.
AI needs context.
For example, if AI detects an abnormal energy pattern in a building, the organization also needs to understand:
which zone is affected,
what equipment is involved,
whether occupancy has changed,
whether weather conditions are influencing demand,
whether maintenance issues are present,
whether control settings are correct,
what action should be taken,
who should take that action.
Without context, AI creates alerts.
With context, AI supports decisions.
That is why dashboards must evolve into AI-ready operational intelligence systems.
The Role of Digital Twins
Digital Twins can become a bridge between dashboards and decisions.
A Digital Twin connects physical assets, digital data, spatial context, operational workflows, and decision logic.
It can bring together:
BIM models,
GIS layers,
IoT data,
asset registers,
maintenance records,
ERP data,
inspection reports,
simulation models,
AI outputs,
dashboards,
workflows.
But the real value of a Digital Twin is not just visualizing these elements together.
The real value is helping teams decide.
For example:
A Digital Twin should not only show equipment condition.
It should help prioritize maintenance.
It should not only show project progress.
It should help identify delay risks.
It should not only show road defects.
It should help prioritize repair based on severity, location, traffic, safety, and budget.
It should not only show energy consumption.
It should help optimize operations.
This is how Digital Twins move from visualization platforms to decision-support systems.
From KPI Dashboards to Decision Workflows
The next enterprise shift requires organizations to redesign how information flows into action.
A KPI dashboard may show a problem.
A decision workflow should define what happens next.
For example:
If an asset health score drops below a threshold, who is notified?
If a flood risk zone becomes critical, which team responds?
If energy use crosses a baseline, what control action is triggered?
If road defects increase in a corridor, how is maintenance prioritized?
If construction progress slips, how is the schedule adjusted?
If a sensor detects an anomaly, how is the alert validated?
Without workflows, dashboards remain passive.
With workflows, insights become action.
This is where operational intelligence creates value.
What Makes a Dashboard Decision-Ready?
Not every dashboard is decision-ready.
A decision-ready dashboard should include more than charts and KPIs.
It should include:
1. Business Context
The dashboard should show why the metric matters.
A number becomes useful when it is linked to cost, risk, safety, performance, compliance, or customer impact.
2. Asset and Location Context
The system should show where the issue is happening and which asset, zone, site, or network is affected.
This is where GIS, BIM, and geospatial intelligence become important.
3. Historical Context
The system should show whether the issue is new, recurring, worsening, or already known.
Past records help teams interpret present signals.
4. Predictive Context
The system should indicate what may happen next if no action is taken.
This is where AI and analytics can create value.
5. Workflow Context
The system should show who should act, what process should follow, and how the action will be tracked.
6. ROI Context
The system should show what value may be created by acting.
This could include avoided downtime, reduced energy use, faster response, lower risk, improved compliance, or better asset utilization.
When these layers are connected, the dashboard becomes more than a visual report.
It becomes part of the decision system.
Sector Examples
In manufacturing, dashboards often show production output, machine status, downtime, and quality metrics. The next step is to connect these indicators with maintenance history, production schedules, asset criticality, quality inspection, and cost impact so that teams can act before failures disrupt operations.
In construction, dashboards may show progress, safety incidents, and cost variance. The next step is to connect them with BIM, site reality capture, procurement status, change orders, workforce availability, and schedule risk so that delays and rework can be reduced.
In utilities, dashboards may show outages, network performance, and work orders. The next step is to connect these with GIS, asset condition, crew availability, customer impact, and fault history to improve response and reliability.
In ports, dashboards may show vessel movement, yard activity, equipment availability, and cargo flow. The next step is to connect these with berth planning, asset condition, route congestion, energy use, and safety zones.
In smart cities, dashboards may show traffic, flooding, waste, public safety, and environment indicators. The next step is to connect these signals with geospatial context, response workflows, citizen impact, and priority actions.
In each case, the shift is the same.
From monitoring performance to improving decisions.
Why Human Judgment Still Matters
Moving from dashboards to decisions does not mean removing humans from the process.
It means giving humans better decision support.
AI and Digital Twins can identify patterns, predict risks, recommend actions, and automate routine workflows.
But human judgment remains essential for accountability, ethics, exceptions, prioritization, and context-sensitive decisions.
The goal is not blind automation.
The goal is better human-machine decision-making.
Enterprises need systems that support decision-makers, not systems that only generate more alerts.
The Enterprise Maturity Shift
This transition can be seen as a maturity path.
Level 1: Static Reporting
Reports are prepared manually and reviewed periodically.
Level 2: Dashboard Visibility
Data is visualized through dashboards and KPIs.
Level 3: Connected Context
Dashboards connect with assets, location, workflows, and historical data.
Level 4: Predictive Intelligence
AI and analytics help anticipate risks and opportunities.
Level 5: Decision Intelligence
Insights are connected to recommended actions, workflows, ownership, and measurable outcomes.
Level 6: Semi-Automated Operations
Routine decisions and workflows become partially automated under governance and human oversight.
Most organizations are somewhere between dashboard visibility and connected context.
The opportunity now is to move toward decision intelligence.
What Enterprises Should Do Next
To move from dashboards to decisions, enterprises should ask:
Which decisions are currently slow, manual, or unreliable?
Which dashboards are used only for reporting, not action?
What context is missing from current dashboards?
Which systems must be connected?
Are assets linked to location, history, and ownership?
Are workflows defined after alerts or insights?
Can AI outputs be trusted and explained?
Who is accountable for action?
How will value be measured?
What is the first use case where decision intelligence can be tested?
These questions help organizations move beyond visual reporting.
They help convert digital systems into operational intelligence.
Closing Thought
Dashboards were an important step in digital transformation.
They helped organizations see.
But the next phase requires more.
Enterprises now need systems that help them decide.
The shift from dashboards to decisions is not just a technology upgrade. It is a change in how organizations connect data, context, workflows, AI, and accountability.
The future will not belong to enterprises with the most dashboards.
It will belong to enterprises that can turn trusted information into timely decisions and measurable action.