When Absence Becomes a Signal
Drought isn’t a single event, it’s a slow, silent imbalance.
It doesn’t crash like a storm or flood overnight. It fades in, through rainfall deficits, soil moisture loss, vegetation stress, and reservoir decline.
The challenge isn’t detecting it, it’s detecting it early .
That’s where geospatial drought indices like SPI (Standardized Precipitation Index) and VCI (Vegetation Condition Index) come in.
Together, they form the foundation of drought early warning stacks , multi-source analytics that quantify how rainfall shortfalls cascade into ecosystem stress.
Decoding the Indices That Read the Land
Drought analysis uses multiple indices because no single layer tells the full story. Each index captures a different symptom of water stress:
1️⃣ SPI – Standardized Precipitation Index
Based on precipitation anomalies from long-term averages.
Computed for time scales (1-, 3-, 6-, 12-month) to capture meteorological vs. hydrological droughts .
SPI < -1.0 → moderate drought, SPI < -2.0 → extreme drought.
Input: IMD rainfall, CHIRPS satellite rainfall, or GPM data.
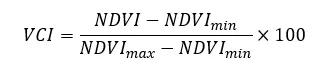
2️⃣ VCI – Vegetation Condition Index
Derived from NDVI (Normalized Difference Vegetation Index).
Measures vegetation health relative to its own seasonal max–min range.
When Absence Becomes a Signal
Drought isn’t a single event, it’s a slow, silent imbalance.
It doesn’t crash like a storm or flood overnight. It fades in, through rainfall deficits, soil moisture loss, vegetation stress, and reservoir decline.
The challenge isn’t detecting it, it’s detecting it early .
That’s where geospatial drought indices like SPI (Standardized Precipitation Index) and VCI (Vegetation Condition Index) come in.
Together, they form the foundation of drought early warning stacks , multi-source analytics that quantify how rainfall shortfalls cascade into ecosystem stress.
Decoding the Indices That Read the Land
Drought analysis uses multiple indices because no single layer tells the full story. Each index captures a different symptom of water stress:
1️⃣ SPI – Standardized Precipitation Index
Based on precipitation anomalies from long-term averages.
Computed for time scales (1-, 3-, 6-, 12-month) to capture meteorological vs. hydrological droughts .
SPI < -1.0 → moderate drought, SPI < -2.0 → extreme drought.
Input: IMD rainfall, CHIRPS satellite rainfall, or GPM data.
2️⃣ VCI – Vegetation Condition Index
Derived from NDVI (Normalized Difference Vegetation Index).
Measures vegetation health relative to its own seasonal max–min range.
VCI < 35% indicates vegetation stress; < 20% signals severe drought.
3️⃣ TCI – Temperature Condition Index
Uses Land Surface Temperature (LST) to detect thermal stress.
High TCI means vegetation under heat load, often preceding visible NDVI decline.
4️⃣ SMI – Soil Moisture Index
Derived from passive microwave sensors (SMAP, Sentinel-1 SAR).
Critical for agricultural drought modeling and crop yield forecasts.
Stacking these indices reveals the multi-stage anatomy of drought , from rain failure to vegetation collapse.
The Drought Stack Framework
Geospatial drought monitoring today relies on multi-layer data fusion , where each index feeds into an integrated risk model.
Index - Source - Indicator Type - Update Frequency
SPI - Rainfall (IMD, CHIRPS) - Meteorological - Weekly / Monthly
VCI - NDVI (MODIS, Sentinel-2) - Agricultural - 10–16 days
TCI - LST (MODIS, Landsat) - Thermal Stress - Weekly
SMI - SMAP / SAR - Soil Moisture - 2–3 days
RAI / PDSI - Model-derived - Hydrological - Monthly
Integration workflow:
1️⃣ Compute each index independently.
2️⃣ Normalize and rescale to 0–1 drought severity scale.
3️⃣ Apply weighted overlay (AHP or PCA-based) to generate a composite Drought Severity Index (DSI) .
4️⃣ Validate against ground data (crop yield, reservoir levels, groundwater depth).
This results in a spatio-temporal drought intelligence layer , visualized as heat maps or time-series animations.
India’s Early Warning Ecosystem
India’s National Agricultural Drought Assessment and Monitoring System (NADAMS) and IMD’s Drought Early Warning System already use such integrated indices:
SPI from CHIRPS rainfall (5 km).
VCI from MODIS NDVI (250 m).
SMI from AMSR-E and Sentinel-1 SAR.
These are fused into composite drought maps at district and taluk scales , delivered through Bhuvan portals and NDMS dashboards.
Example (2023): During the delayed southwest monsoon, SPI detected rainfall deficit in Marathwada by June.
By late July, VCI dropped below 35%, confirming agricultural drought onset .
Early warning helped state agencies activate contingency crop advisories , reducing yield loss by an estimated 12–15%.
From Indices to Actionable Insights
When integrated into GIS workflows, drought indices move from research outputs to decision systems :
Agriculture: Identify at-risk districts for seed variety change or crop insurance triggers.
Water Resources: Prioritize groundwater recharge and tank revival in stress zones.
Disaster Management: Combine with population density to map drought exposure and vulnerability.
Energy Planning: Predict hydropower shortfalls from cumulative rainfall deficits.
Drought indices aren’t just maps, they’re early conversations with climate data.
GeoAI and Predictive Drought Analytics
Machine learning now enables drought prediction weeks ahead of observable impact:
Time-series ML models (LSTM, Prophet): Forecast SPI and VCI trends.
Multi-sensor data fusion: Combine CHIRPS, MODIS, and SMAP inputs for higher spatial fidelity.
Anomaly Detection Algorithms: Identify local deviations from baseline before drought onset.
AI doesn’t replace traditional indices, it amplifies them, transforming static indicators into real-time forecasting engines.
Case Example: SPI–VCI Integration in Gujarat
The Gujarat State Disaster Management Authority (GSDMA) piloted a SPI–VCI fusion model across Saurashtra:
Weekly SPI maps derived from CHIRPS rainfall at 5 km resolution.
VCI computed from MODIS NDVI at 250 m resolution.
Combined Drought Severity Index successfully predicted drought onset 3 weeks earlier than field reports.
Integration with groundwater depth rasters improved local action, ensuring early deployment of tanker supply and livestock feed distribution.
Outlook: Toward Drought Digital Twins
A Drought Digital Twin integrates indices, IoT sensors, and hydrological models into a unified platform that “lives” with the climate:
Real-time SPI updates from rainfall sensors.
Dynamic NDVI–VCI feedback from satellites.
Coupled groundwater and soil moisture models for prediction.
Such twins could serve as climate dashboards for policymakers , forecasting drought severity, duration, and economic loss at multiple scales.
This would shift drought response from reactive relief to data-driven resilience.
Conclusion
Drought indices are more than analytical tools, they are the language through which the land tells us it’s stressed.
By stacking SPI, VCI, TCI, and SMI together, we translate rainfall patterns, vegetation response, and soil health into actionable intelligence.
In this new geospatial framework, the warning doesn’t come from panic, it comes from patterns.
VCI < 35% indicates vegetation stress; < 20% signals severe drought.
3️⃣ TCI – Temperature Condition Index
Uses Land Surface Temperature (LST) to detect thermal stress.
High TCI means vegetation under heat load, often preceding visible NDVI decline.
4️⃣ SMI – Soil Moisture Index
Derived from passive microwave sensors (SMAP, Sentinel-1 SAR).
Critical for agricultural drought modeling and crop yield forecasts.
Stacking these indices reveals the multi-stage anatomy of drought , from rain failure to vegetation collapse.
The Drought Stack Framework
Geospatial drought monitoring today relies on multi-layer data fusion , where each index feeds into an integrated risk model.
Index - Source - Indicator Type - Update Frequency
SPI - Rainfall (IMD, CHIRPS) - Meteorological - Weekly / Monthly
VCI - NDVI (MODIS, Sentinel-2) - Agricultural - 10–16 days
TCI - LST (MODIS, Landsat) - Thermal Stress - Weekly
SMI - SMAP / SAR - Soil Moisture - 2–3 days
RAI / PDSI - Model-derived - Hydrological - Monthly
Integration workflow:
1️⃣ Compute each index independently.
2️⃣ Normalize and rescale to 0–1 drought severity scale.
3️⃣ Apply weighted overlay (AHP or PCA-based) to generate a composite Drought Severity Index (DSI) .
4️⃣ Validate against ground data (crop yield, reservoir levels, groundwater depth).
This results in a spatio-temporal drought intelligence layer , visualized as heat maps or time-series animations.
India’s Early Warning Ecosystem
India’s National Agricultural Drought Assessment and Monitoring System (NADAMS) and IMD’s Drought Early Warning System already use such integrated indices:
SPI from CHIRPS rainfall (5 km).
VCI from MODIS NDVI (250 m).
SMI from AMSR-E and Sentinel-1 SAR.
These are fused into composite drought maps at district and taluk scales , delivered through Bhuvan portals and NDMS dashboards.
Example (2023): During the delayed southwest monsoon, SPI detected rainfall deficit in Marathwada by June.
By late July, VCI dropped below 35%, confirming agricultural drought onset .
Early warning helped state agencies activate contingency crop advisories , reducing yield loss by an estimated 12–15%.
From Indices to Actionable Insights
When integrated into GIS workflows, drought indices move from research outputs to decision systems :
Agriculture: Identify at-risk districts for seed variety change or crop insurance triggers.
Water Resources: Prioritize groundwater recharge and tank revival in stress zones.
Disaster Management: Combine with population density to map drought exposure and vulnerability.
Energy Planning: Predict hydropower shortfalls from cumulative rainfall deficits.
Drought indices aren’t just maps, they’re early conversations with climate data.
GeoAI and Predictive Drought Analytics
Machine learning now enables drought prediction weeks ahead of observable impact:
Time-series ML models (LSTM, Prophet): Forecast SPI and VCI trends.
Multi-sensor data fusion: Combine CHIRPS, MODIS, and SMAP inputs for higher spatial fidelity.
Anomaly Detection Algorithms: Identify local deviations from baseline before drought onset.
AI doesn’t replace traditional indices, it amplifies them, transforming static indicators into real-time forecasting engines.
Case Example: SPI–VCI Integration in Gujarat
The Gujarat State Disaster Management Authority (GSDMA) piloted a SPI–VCI fusion model across Saurashtra:
Weekly SPI maps derived from CHIRPS rainfall at 5 km resolution.
VCI computed from MODIS NDVI at 250 m resolution.
Combined Drought Severity Index successfully predicted drought onset 3 weeks earlier than field reports.
Integration with groundwater depth rasters improved local action, ensuring early deployment of tanker supply and livestock feed distribution.
Outlook: Toward Drought Digital Twins
A Drought Digital Twin integrates indices, IoT sensors, and hydrological models into a unified platform that “lives” with the climate:
Real-time SPI updates from rainfall sensors.
Dynamic NDVI–VCI feedback from satellites.
Coupled groundwater and soil moisture models for prediction.
Such twins could serve as climate dashboards for policymakers , forecasting drought severity, duration, and economic loss at multiple scales.
This would shift drought response from reactive relief to data-driven resilience.
Conclusion
Drought indices are more than analytical tools, they are the language through which the land tells us it’s stressed.
By stacking SPI, VCI, TCI, and SMI together, we translate rainfall patterns, vegetation response, and soil health into actionable intelligence.
In this new geospatial framework, the warning doesn’t come from panic, it comes from patterns.