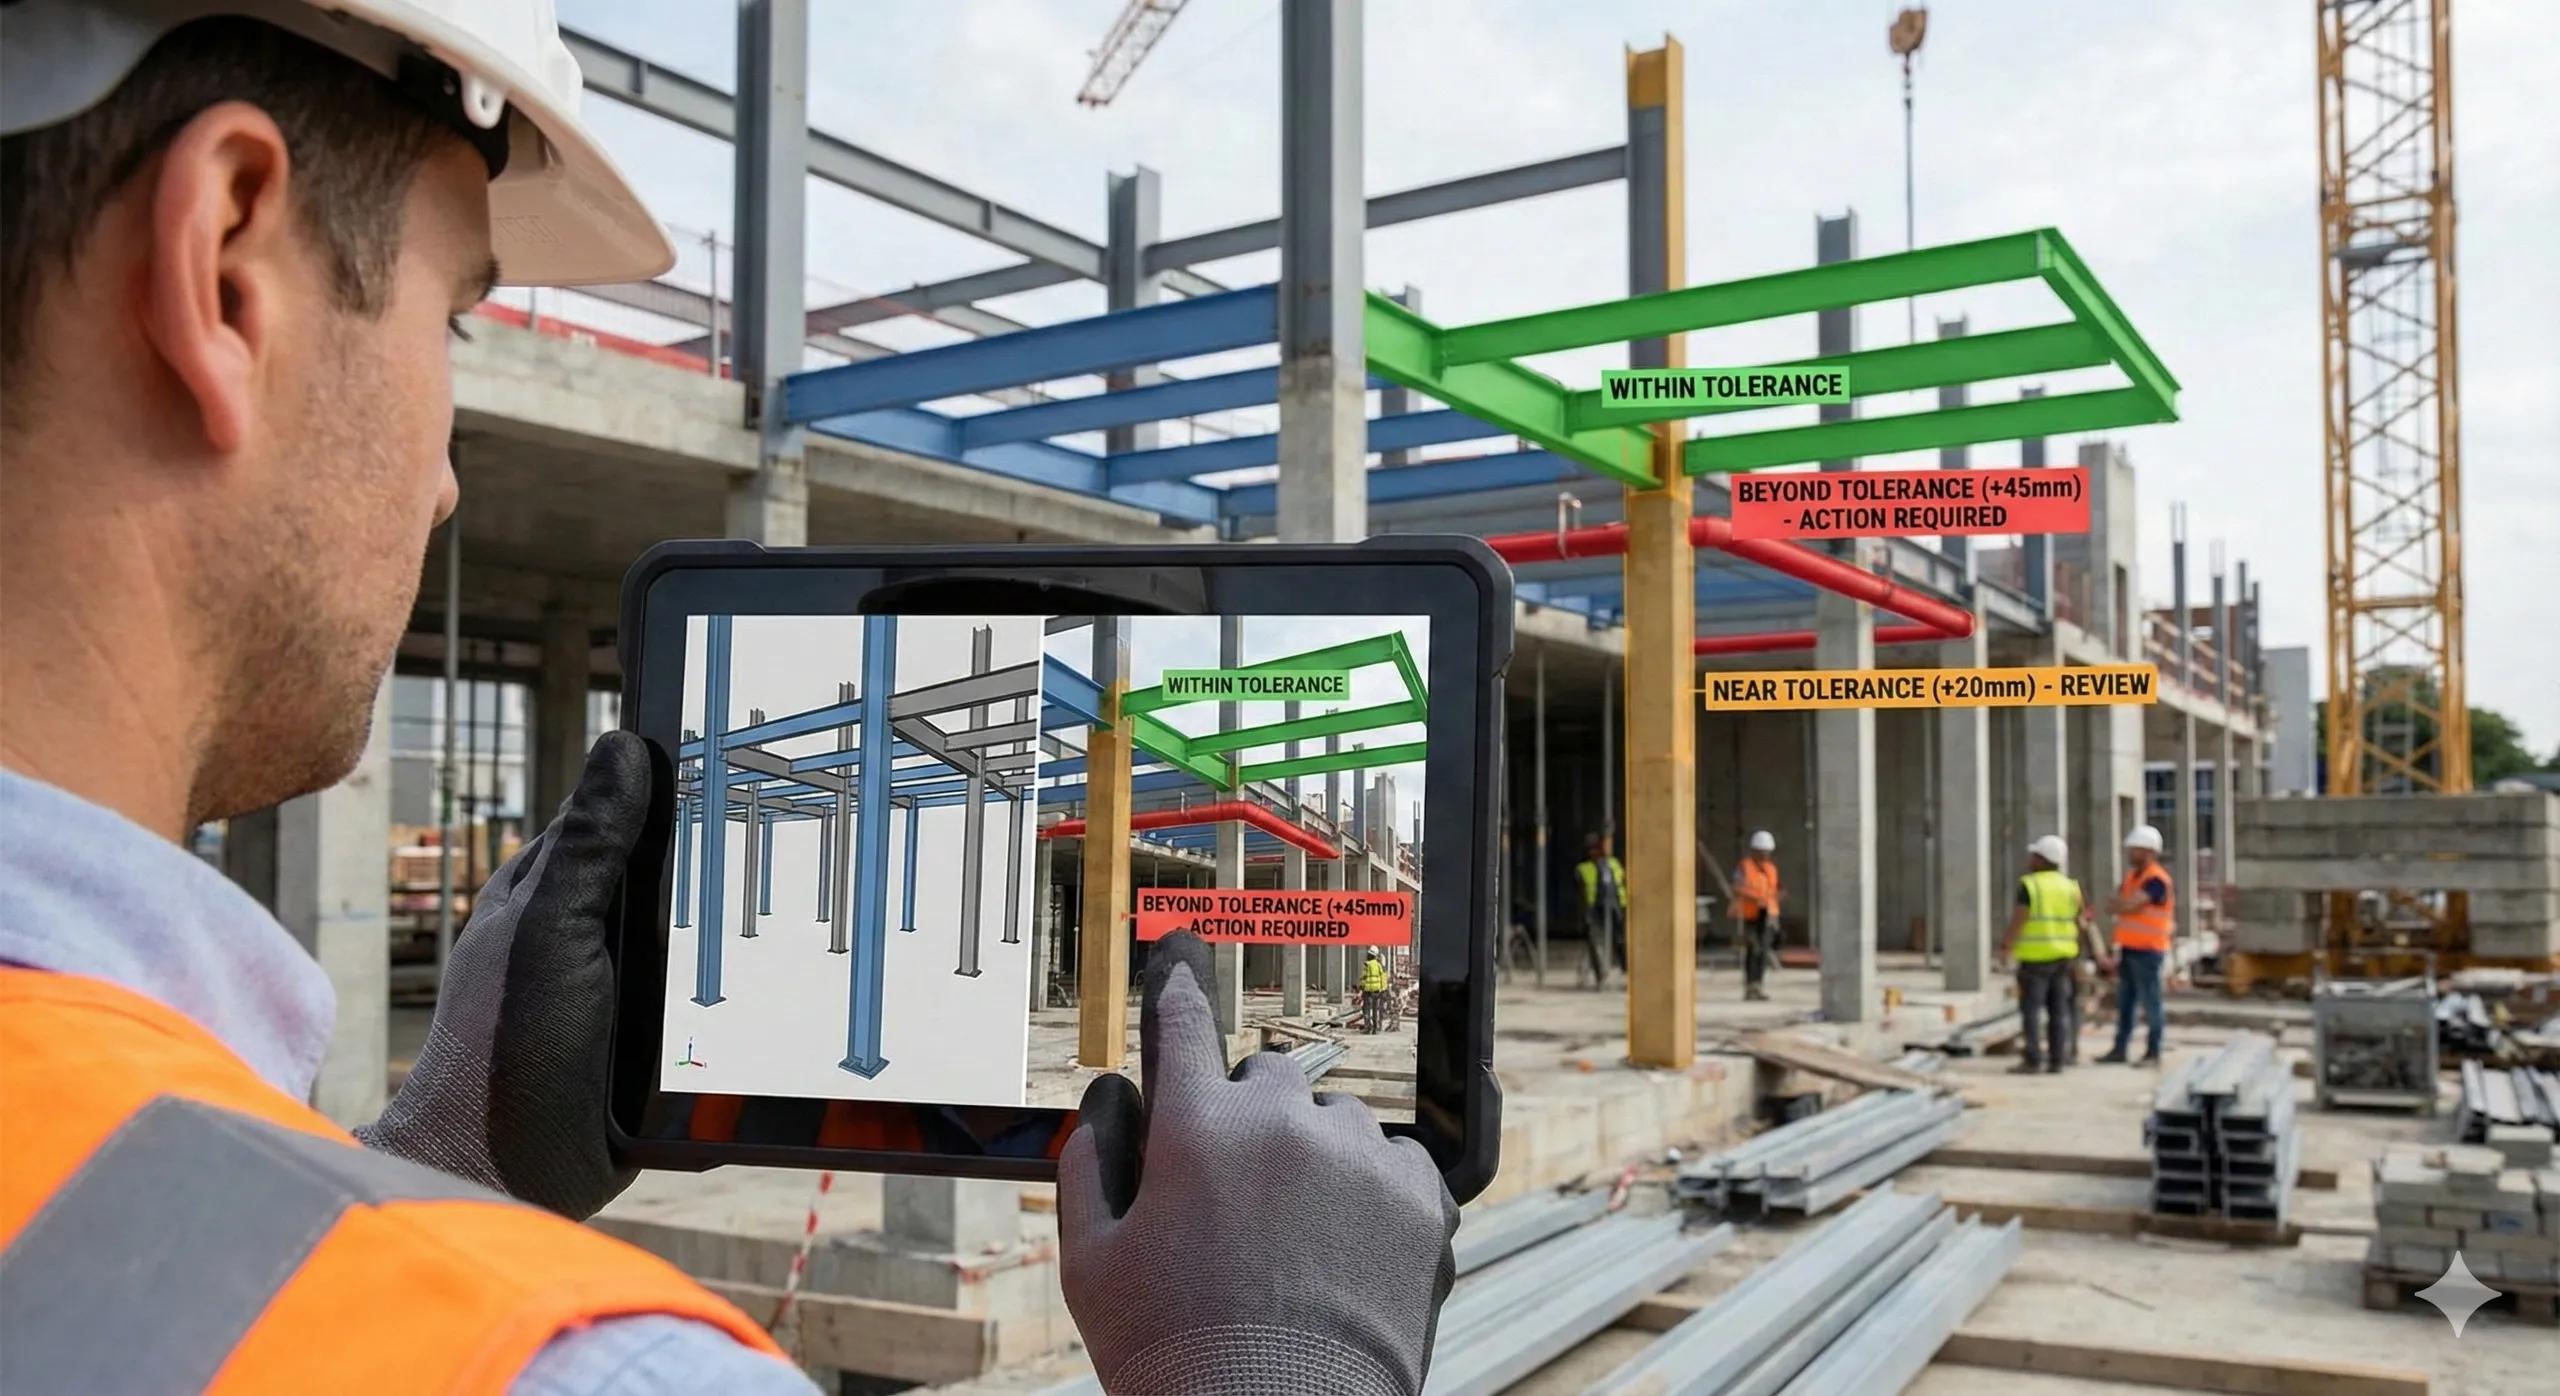
Dimensional deviation analysis is often misunderstood as a forensic exercise, something teams do only after things go wrong. In reality, deviation analysis is a proactive control mechanism that tells you whether construction is drifting away from intent before that drift becomes expensive.
The mistake most teams make is treating deviation as a visual comparison. Colors appear. Screenshots circulate. Discussions drag on.
But deviation analysis is not about seeing differences .
It is about deciding whether those differences matter .
This article explains how to compare field reality against design in a way that produces clear, defensible actions , not just technical outputs.
1. Why “Deviation” Is the Wrong Starting Point
Most workflows begin by asking:
How far is reality from design?
The better question is:
How much deviation can we afford at this stage?
Without agreed thresholds, deviation analysis creates:
Noise instead of insight
Arguments instead of decisions
Overreaction to harmless variance
Deviation is meaningful only in context .
2. Dimensional Deviation Is Phase-Dependent
Deviation tolerance changes over time.
Early structure → larger tolerance bands acceptable
MEP rough-in → tighter tolerances at interfaces
Fit-out & commissioning → minimal tolerance
Applying final-stage tolerances during early works guarantees false alarms.
3. Preconditions for Trustworthy Deviation Analysis
Before running any comparison, confirm:
✔ Scans are properly registered
✔ Data is georeferenced to the project CRS
✔ Vertical datum is verified
✔ Point clouds are filtered and classified
✔ BIM geometry represents approved intent
If any of these fail, deviation results are unreliable.
4. What Should Be Compared (Selectively)
Effective deviation analysis is element-based , not global.
Compare:
Column centerlines vs design axes
Slab soffits vs design elevations
Beam alignments vs grid geometry
Critical MEP routes vs clearance envelopes
Avoid:
Whole point cloud vs whole BIM
Temporary works vs permanent design
Clutter vs geometry
Precision comes from focus .
5. Distance Is Not the Same as Impact
A 30 mm deviation does not always mean the same thing.
30 mm on a column → often manageable
30 mm on a duct in a ceiling void → potentially catastrophic
Deviation analysis must be tied to:
Downstream trades
Access and maintenance
Safety and compliance
Numbers without impact assessment mislead.
6. Bands, Not Gradients
Continuous heat maps encourage debate.
Decision bands enable action.
A practical structure:
Green → within tolerance, proceed
Amber → near tolerance, review
Red → beyond tolerance, action required
These bands must be agreed before analysis begins.
7. Reporting Deviations for the Field
Field teams need clarity, not density.
Effective outputs include:
Element ID
Location / zone
Direction and magnitude of deviation
Required action (monitor / correct / accept)
They do not need:
Full point cloud files
Artistic color maps
Long technical explanations
Deviation reports must drive tomorrow’s work .
8. Deviation vs Progress: Do Not Mix Them
A common failure is reading progress into deviation data.
Progress asks: Is it built?
Deviation asks: Is it built where it should be?
A completed element can still be out of tolerance.
A missing element has no deviation.
Mixing the two creates false confidence.
9. Indian Context: Why Early Deviation Matters More
On Indian projects:
Corrections get harder as density increases
Rework costs escalate quickly
Documentation gaps amplify disputes
Early, targeted deviation analysis:
Prevents cascading errors
Reduces blame-based coordination
Protects schedule and margins
Deviation analysis works best as risk prevention , not fault detection.
10. A Simple Deviation Rule
Before running any analysis, ask:
If this deviation exceeds tolerance today, what decision will we take tomorrow?
If the answer is unclear, the analysis is premature.
Conclusion
Dimensional deviation analysis is not about proving mistakes.
It is about controlling drift .
When done correctly:
Errors are caught early
Interfaces stay viable
Decisions are objective
BIM becomes operational
When done poorly:
Heat maps replace judgment
Teams argue over numbers
Digital tools lose credibility
In BIM-to-field workflows, deviation analysis succeeds only when it is framed as a decision tool, not a technical report .