Boards don’t fund dashboards
Boards do not ask:
“How many maps did we generate this quarter?”
They ask:
How exposed are we?
Where is capital at risk?
What is our resilience profile?
Are we over-concentrated?
What is the long-term vulnerability curve?
If spatial intelligence cannot answer those questions numerically, it remains operational.
Board-level influence requires board-level metrics.
Why most spatial KPIs fail
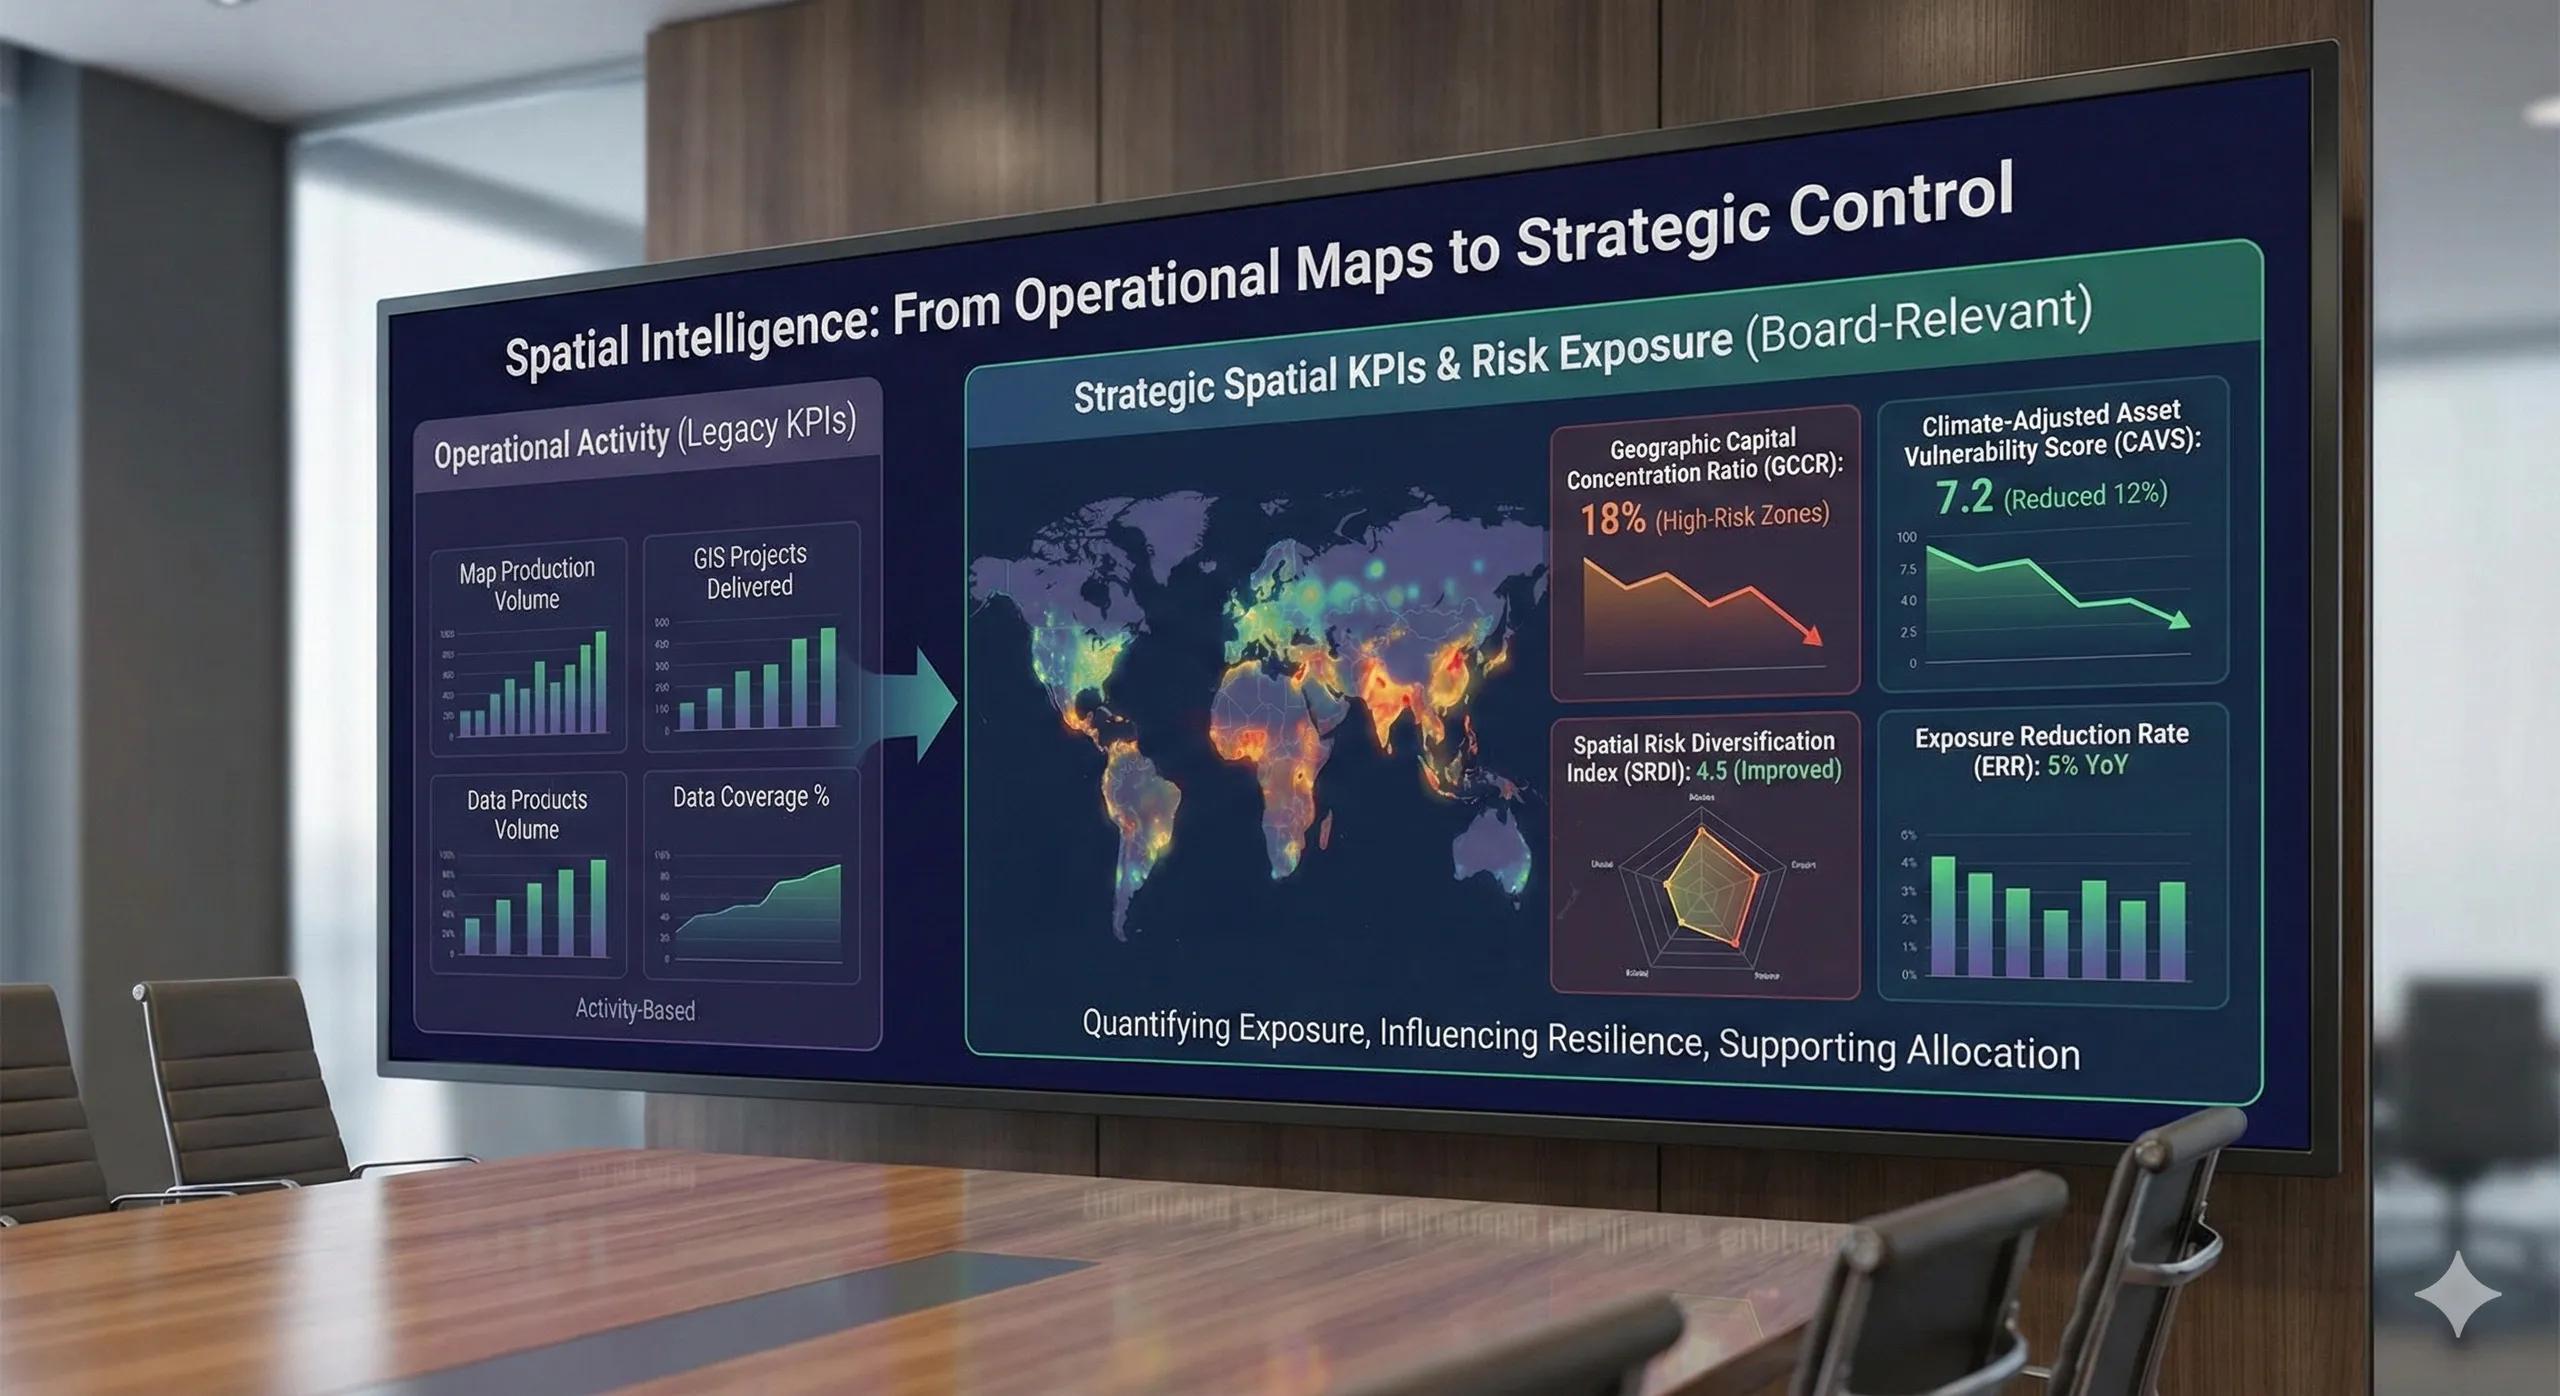
Common spatial KPIs include:
Number of GIS projects delivered
Map production volume
Data coverage percentage
System uptime
These measure activity.
Boards measure impact.
The gap between activity and impact is where spatial initiatives stall.
What makes a KPI board-relevant?
Board-relevant KPIs must:
Link directly to capital exposure
Quantify risk concentration
Support strategic allocation decisions
Influence resilience posture
Be comparable across time
If a spatial KPI cannot influence a capital or risk decision, it will not survive executive scrutiny.
Examples of Spatial KPIs That Matter
Here are structured examples aligned with governance language.
1. Geographic Capital Concentration Ratio (GCCR)
What it measures: Percentage of total capital located within high-risk zones.
Why boards care: Concentration amplifies correlated loss.
2. Climate-Adjusted Asset Vulnerability Score (CAVS)
What it measures: Weighted exposure of assets to climate volatility scenarios.
Why boards care: Supports long-term resilience planning and insurance positioning.
3. Service Accessibility Coverage Index (SACI)
What it measures: Population or demand clusters within defined service thresholds.
Why boards care: Links infrastructure footprint to growth opportunity and equity performance.
4. Spatial Risk Diversification Index (SRDI)
What it measures: Geographic spread of critical assets across risk zones.
Why boards care: Diversification reduces systemic fragility.
5. Exposure Reduction Rate (ERR)
What it measures: Year-over-year decline in assets located in high-risk geographies.
Why boards care: Demonstrates proactive mitigation.
A practical scenario
Consider an infrastructure company presenting quarterly updates.
Version A:
Project completion reports
Asset counts
Map overlays
Version B:
Geographic Capital Concentration Ratio trending downward
Climate-adjusted vulnerability exposure reduced 12%
Diversification index improved across regions
Both use spatial data.
Only one speaks board language.
The structural requirement
To produce board-ready KPIs, spatial workflows must be designed differently:
Risk layers standardized
Scoring models documented
Version control enforced
Integration with financial systems established
You cannot retrofit board metrics onto unstructured analysis.
Workflow design determines executive relevance.
Where organizations hesitate
Common obstacles:
Fear of quantifying exposure
Disconnected GIS and finance systems
Lack of leadership spatial literacy
Inconsistent analyst methodologies
But without quantification, geography remains descriptive, not directive.
Boards act on numbers.
The monetization bridge
As enterprises elevate spatial intelligence into governance systems, many seek structured KPI frameworks and scalable spatial platforms that translate geographic exposure into standardized board-ready metrics aligned with capital allocation and risk governance.
The shift is not technical.
It is architectural.
Looking ahead
In the coming decade, organizations will increasingly disclose:
Climate-adjusted geographic risk
Infrastructure exposure concentration
Regional diversification metrics
Spatial KPIs will become part of strategic reporting, not technical appendices.
Closing insight
Maps inform.
Metrics influence.
KPIs institutionalize.
When geography becomes measurable in financial terms, it becomes part of strategic control.