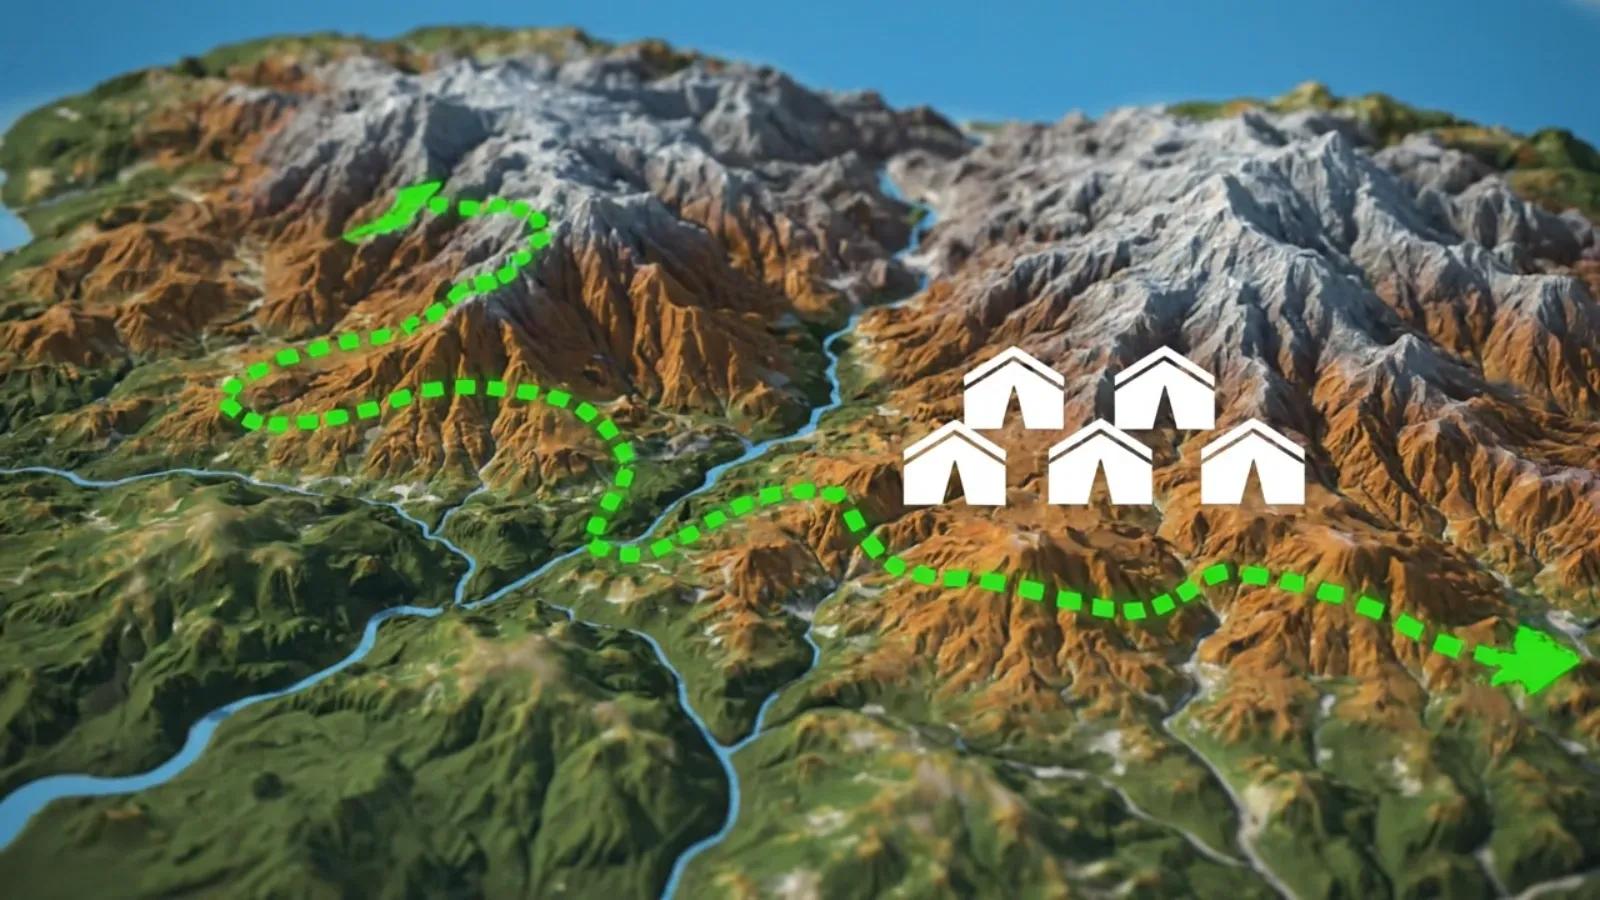
From Elevation Data to Decision Intelligence
Digital Elevation Models (DEMs) may look like grids of elevation values but hidden in those pixels is a powerful decision framework.
Each change in relief dictates how water flows, where infrastructure stands, and how people move.
Turning a DEM into actionable intelligence means moving from topography → terrain → risk , decoding how elevation shapes accessibility, stability, and planning outcomes.
Decoding Relief: The Foundation of Spatial Planning
Relief, the difference between the highest and lowest points in an area, is not just a physical metric. It defines risk zones, mobility corridors, and economic potential .
A region with steep slopes may challenge construction but provide hydropower potential. A gentle gradient may be ideal for settlements but prone to flooding.
When DEMs are integrated into GIS models, they allow planners to quantify such trade-offs spatially.
Key terrain derivatives from DEMs:
Slope: Determines ease of construction, erosion potential, and soil stability.
Aspect: Influences solar exposure and microclimate, critical for siting renewable energy and agriculture.
Curvature: Defines flow concentration zones and structural control for drainage.
Relative Relief: Captures terrain ruggedness, a quick indicator of developmental feasibility.
In essence, DEM derivatives transform elevation into design intelligence.
From Pixels to Risk Layers
Modern risk assessment begins with terrain. DEMs provide vertical reference for nearly every hazard model, floods, landslides, or accessibility planning.
1. Flood Risk
DEM-based hydrological modeling (flow accumulation, depression filling) predicts floodplain extents.
High-resolution DEMs from LiDAR or UAVs allow sub-meter accuracy for inundation mapping.
Integration with rainfall data generates dynamic flood simulation twins.
2. Landslide Susceptibility
Steepness, curvature, and geological overlay derived from DEMs feed into susceptibility models.
For example, the Himalayan region uses Landslide Hazard Zonation (LHZ) maps derived from 10–30m DEMs to plan roads and settlements.
3. Infrastructure Accessibility
DEMs guide route optimization, finding least-cost paths for roads or transmission lines while minimizing environmental impact.
Combining DEMs with land use and population density layers supports Accessibility Index modeling for emergency response.
Every risk map, whether hydrological or seismic, begins with a terrain surface.
Siting and Design: The Vertical Dimension of Planning
Whether it’s a city, dam, or solar park, location decisions depend on terrain feasibility. DEM-derived analytics make this measurable:
Slope Thresholds: Identify zones <10° slope for stable construction.
Aspect and Insolation: Optimize solar farm orientation.
Elevation and Floodplain Buffers: Avoid low-lying high-risk zones.
Drainage Path Modeling: Design natural runoff routes to prevent waterlogging.
In the Smart City Mission and Bharatmala highway projects , DEMs are embedded in route alignment tools to minimize cut-fill volumes and optimize accessibility.
This marks the transition from topographic awareness to spatial risk intelligence.
Case Example: Assam Floodplain Risk Mapping
In the Brahmaputra Basin, seasonal flooding affects millions annually. Researchers used CartoDEM (10m) and Sentinel-1 SAR data to:
Derive elevation contours and flow accumulation grids.
Simulate flood inundation under different discharge scenarios.
Generate a Flood Hazard Index by integrating slope, elevation, land use, and distance to river.
The model accurately identified flood-prone villages, supporting proactive relocation and infrastructure planning.
This demonstrates how DEM-derived risk surfaces guide ground-level resilience planning.
GeoAI and DEM Analytics
Machine learning enhances DEM applications beyond manual interpretation.
Random Forest models correlate terrain variables with historical hazard data to predict susceptibility zones.
Deep learning identifies microtopographic features (levees, drainage depressions) invisible in coarse DEMs.
AI-based interpolation improves DEM quality in cloud-prone or data-sparse regions.
These advancements convert static elevation grids into living analytical surfaces that continuously learn from new satellite and sensor data.
From Relief to Resilience
Relief isn’t just a backdrop, it’s a driver of vulnerability .
By analyzing how elevation interacts with human systems, transportation, housing, agriculture, planners can move from reactive mitigation to proactive design.
Modern geospatial risk frameworks now operate on three pillars:
Decode: Extract terrain features from DEMs.
Digitize: Integrate with climate, land, and population data.
Amplify: Translate into policy and planning decisions.
This pixel-to-plan transition is what makes terrain analytics a backbone of resilient infrastructure and disaster management.
Outlook: From DEMs to Digital Twins
The next frontier is linking DEMs to real-time monitoring. IoT-enabled flood sensors, seismic instruments, and drones can update DEM-based risk twins dynamically.
Imagine a city-scale digital twin where rainfall data instantly updates flood models, or a highway twin that visualizes slope stability after an earthquake.
That’s where DEMs evolve, from static elevation maps to dynamic terrain intelligence systems.
Conclusion
A DEM is never just a dataset, it’s a decision surface.
Every contour tells a story of opportunity and risk.
From flood mapping to city design, turning elevation pixels into planning insights allows us to see the land not as static ground, but as a living, data-rich system guiding how we build, move, and adapt.