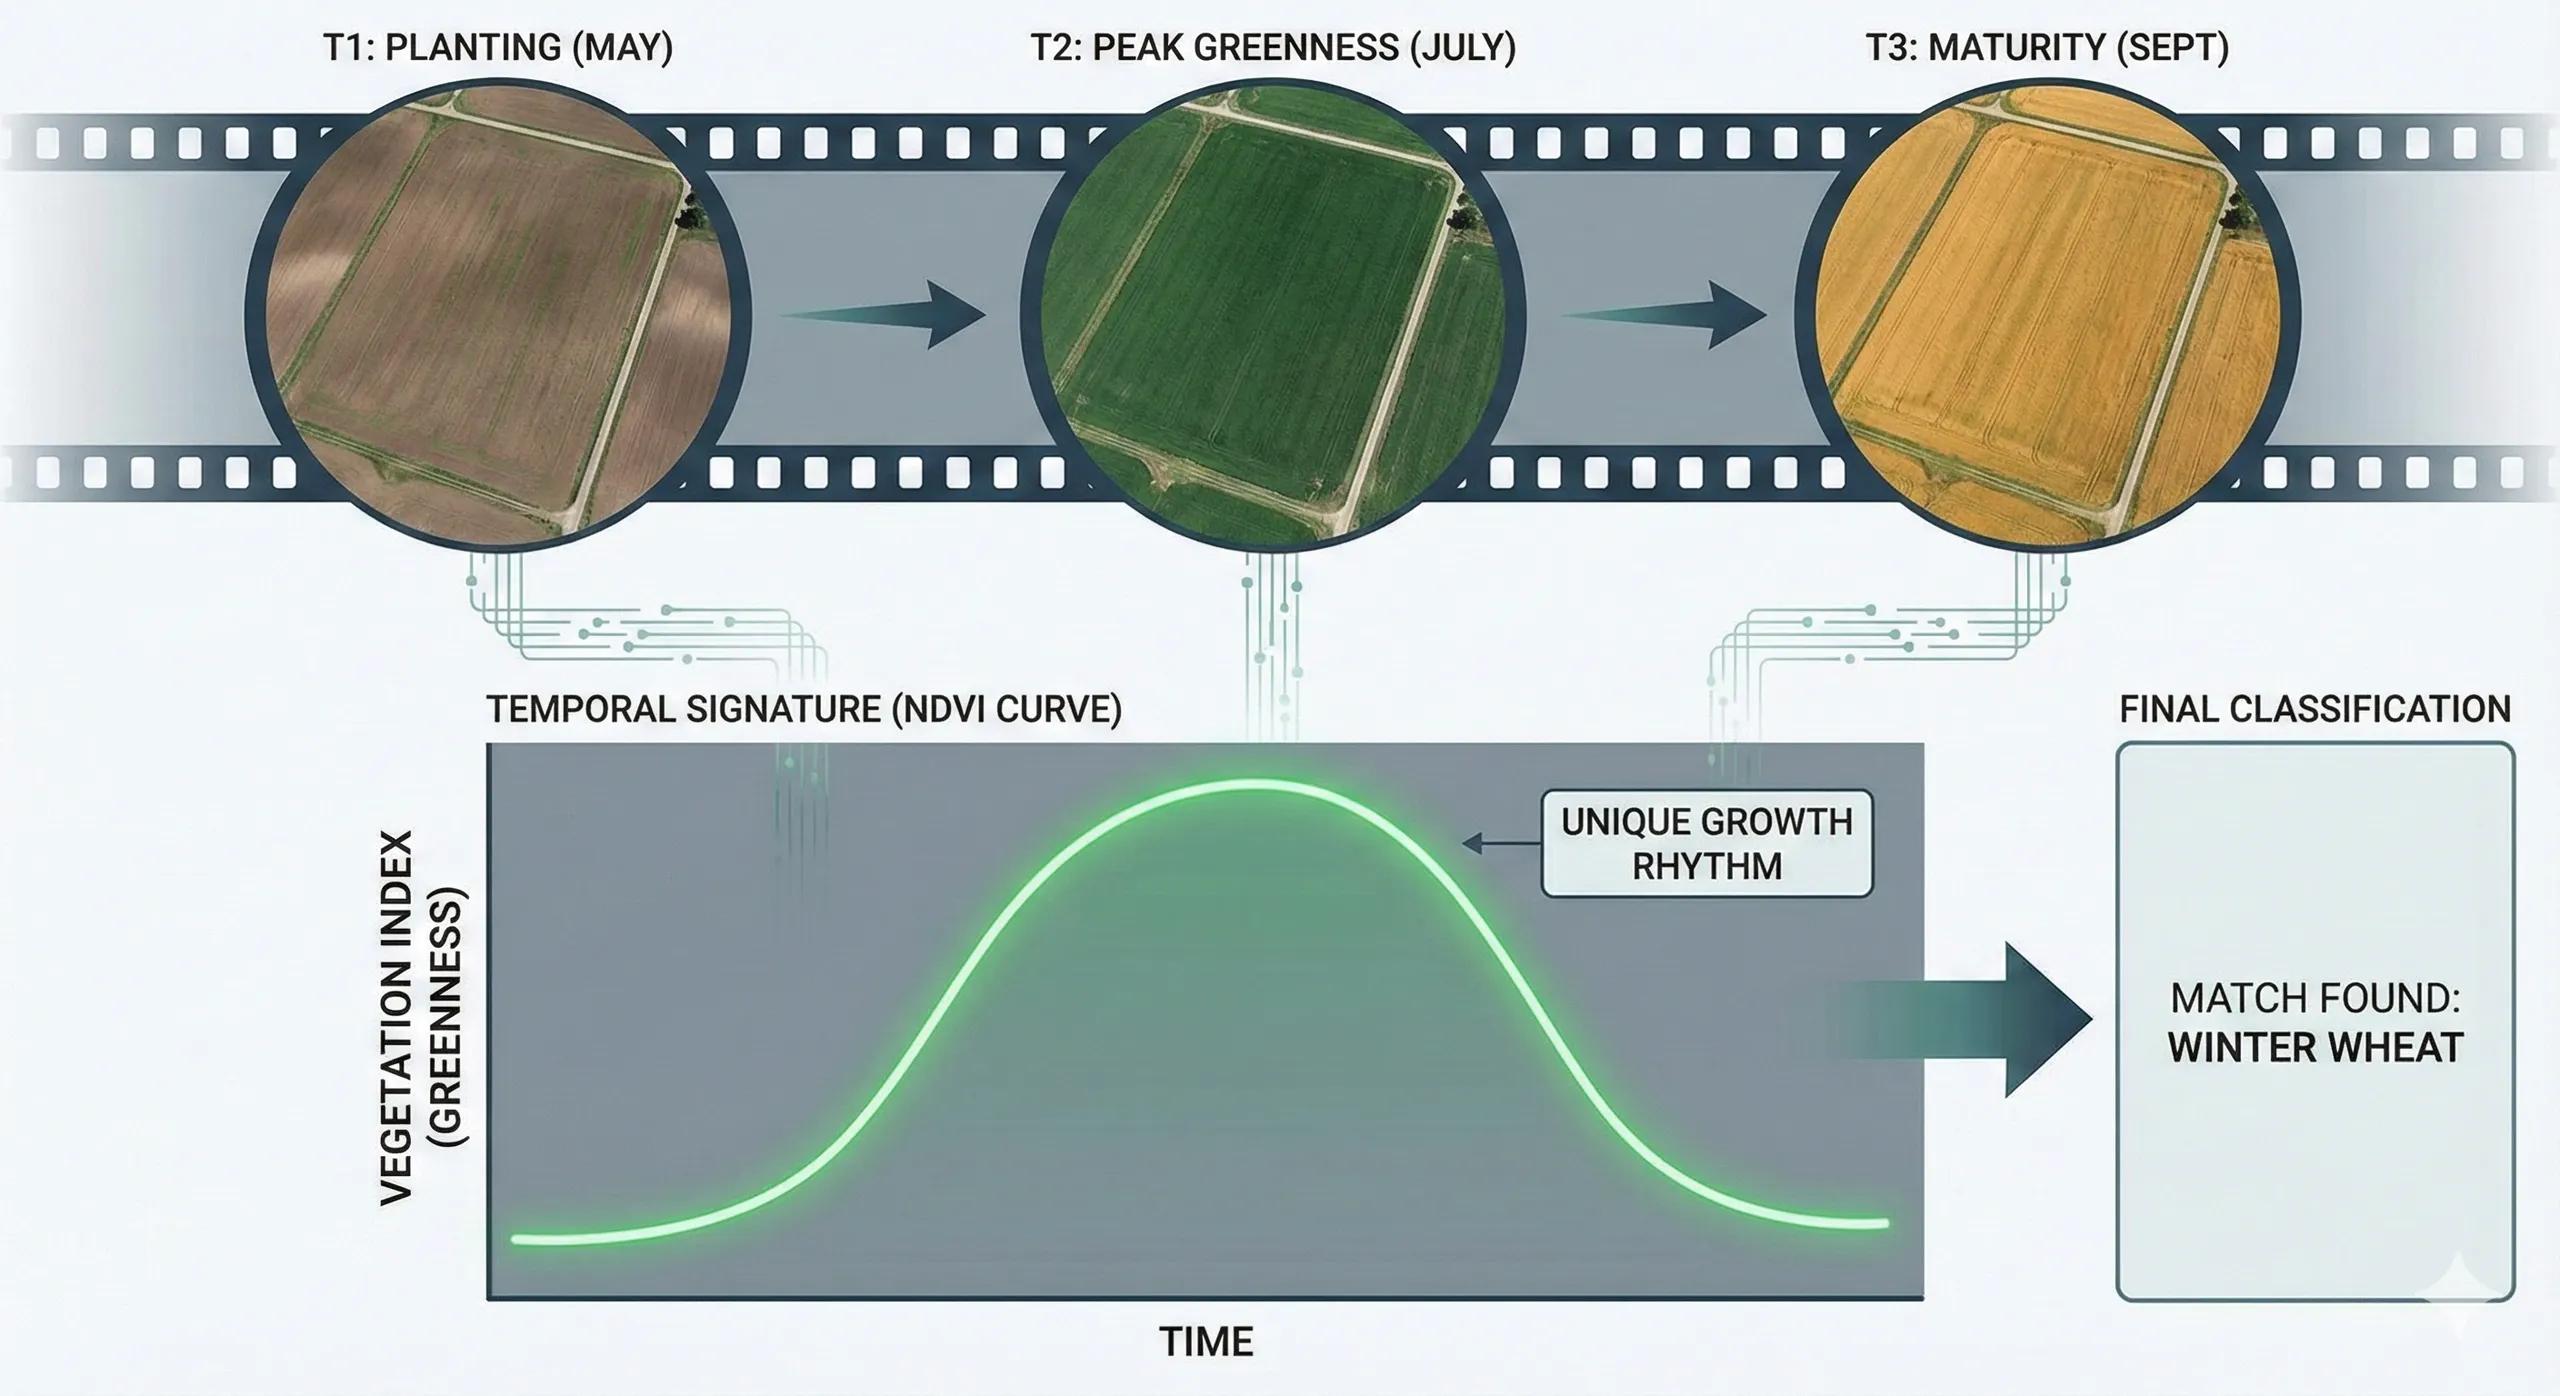
What if every crop could be identified not by a single image, but by its rhythm across the growing season?
Unlike land cover, crop type is not a static label .
It is a temporal identity , a growth curve, a phenological fingerprint, a sequence of greening, peaking, and senescence unique to each crop.
This is why time-series remote sensing has become the most reliable method for crop classification.
Not pixels.
Not single-scene signatures.
But patterns through time .
1️⃣ Why Time-Series Is Essential for Crop Mapping
A single satellite image can confuse:
wheat vs mustard
rice vs sugarcane
maize vs sorghum
cotton vs pulses
But a time-series reveals the story of the crop.
Key differentiators:
planting date
rate of canopy development
peak NDVI timing
phenology length
senescence speed
irrigation patterns
harvest timing
Every crop follows a different temporal path, making time-series the ground truth for classification .
2️⃣ Temporal Signatures: The Phenology Curve
Time-series from Sentinel-2, Landsat-8/9, and PlanetScope generate NDVI/EVI/RENDVI curves for each pixel.
Typical signatures:
Rice
sharp early-season water signature (low NDVI, high backscatter)
rapid greening
strong peak
sharp drop at harvest
Wheat
cool-season start
steady growth
distinct peak in Feb/March
moderate decline
Cotton
long-season crop
slow buildup
prolonged plateau
late senescence
Sugarcane
multi-month growth
sustained high NDVI
no sharp harvest signal
Maize
rapid early-stage growth
shorter cycle
predictable bell-shaped NDVI curve
These curves form the temporal fingerprints that AI models learn.
3️⃣ Time-Series Classification Workflows
Crop mapping uses one of three approaches:
A. Pixel-Based Machine Learning
Inputs:
NDVI/EVI time-series
SAR time-series (very useful for Kharif/monsoon)
Red-edge bands
Texture metrics
Models:
Random Forest
XGBoost
SVM
Strength: stable, interpretable.
B. Deep Learning Workflows
LSTM / GRU models capture temporal dependencies
1D CNN learns shape of the phenology curve
Transformers process large time-series efficiently
Best for large-scale, high-frequency temporal datasets.
C. Object-Based Time-Series Classification (OBIA/GEOBIA)
segmentation before classification
reduces noise
ideal for irregular agricultural parcels
outputs cleaner maps
Especially useful in India’s fragmented field landscapes.
4️⃣ SAR Time-Series for Cloudy Seasons
Optical time-series fail during monsoon, which is exactly when Kharif crops grow.
SAR (Sentinel-1) solves this:
sensitive to canopy structure
captures sowing moisture signature
identifies irrigation patterns
tracks biomass buildup
detects early lodging
stable through clouds and rain
A hybrid optical–SAR temporal stack gives the most accurate crop maps for India.
5️⃣ Labeling: The Hardest Part
Models need ground truth .
Sources include:
farmer records
crop-cutting experiments (CCEs)
mandi procurement datasets
field surveys
mobile apps + AI-assisted labeling
government agricultural department records
Once trained, models generalize well across districts and seasons, with 70–90% accuracy .
6️⃣ India: Why Time-Series Crop Mapping Matters
India’s agricultural challenges require dynamic, timely crop intelligence :
MSP procurement planning
mandi price forecasting
irrigation scheduling
groundwater estimation
insurance & loss assessment
drought response
carbon farming baselines
yield modeling
crop diversification programs
Time-series crop maps allow district/state governments to act weeks or months earlier than traditional surveys.
7️⃣ Toward Crop Digital Twins
A Crop Digital Twin integrates:
time-series NDVI/EVI
SAR canopy buildup
sowing/harvest detection
irrigation events
rainfall + ET
crop growth models (WOFOST/DSSAT)
yield estimation
pest/disease risk signals
carbon uptake
market demand
This transforms crop monitoring into live agricultural intelligence .
Conclusion
Crop type is not a static classification problem, it is a temporal story only visible through multi-date satellite imagery.
Time-series mapping unlocks the real identity of crops, turning fields into seasonal signals and enabling reliable, scalable agricultural intelligence.
A single pixel in one image can lie.
A time-series almost never does.