The Space Between Habitats
Forests may appear continuous from above, but for the species moving within them, even a road or farm can be a wall.
Wildlife survival depends not only on habitat quality but on connectivity , the ability to move, disperse, and maintain genetic flow across landscapes.
Fragmentation breaks these links. Corridors restore them.
And with geospatial least-cost path modeling , scientists can now map, quantify, and optimize the invisible highways of wildlife movement.
The Problem: Islands of Green in a Sea of Development
Across India, infrastructure growth, roads, railways, mining, and urban sprawl, has split contiguous habitats into ecological islands .
Species such as tigers, elephants, and leopards now navigate a patchwork of safe zones and risk zones .
Fragmentation impacts include:
Reduced genetic exchange between populations.
Increased human–wildlife conflict.
Higher mortality from road and rail collisions.
Ecosystem imbalance due to restricted migration.
Understanding where species can move, and how costly each route is, requires turning landscapes into resistance surfaces .
Building the Resistance Surface
In geospatial ecology, every pixel represents the cost of movement , how difficult it is for a species to traverse that terrain.
Resistance value examples:
Land Cover Type - Cost (0–100 scale) - Description
Dense Forest - 1–5 - Low resistance; preferred habitat
Shrub / Grassland - 10–20 - Moderate resistance
Agricultural Land - 40–60 - Fragmented matrix
Urban Area - 80–100 - High resistance; barrier
Rivers / Roads - 90–100 - Physical barrier
These values are species-specific, what’s impassable for a sloth bear may be manageable for a leopard.
Resistance layers are generated using land use, slope, vegetation density (NDVI), water bodies, and human footprint data.
The Least-Cost Path (LCP) Model
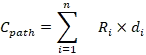
Once the resistance surface is ready, least-cost path algorithms compute the optimal movement corridor between two habitat patches, the route with the lowest cumulative “travel cost.”
Where R (i) = resistance of pixel i, and d (i) = distance traveled within it.
These paths represent most probable animal movement routes , balancing habitat preference and landscape permeability.
To model population-scale movement, circuit theory models (e.g., Circuitscape ) simulate multiple pathways as current flow , revealing both core corridors and diffuse linkages .
India’s Connectivity Initiatives
India’s wildlife corridors are increasingly being mapped through spatial modeling frameworks.
1️⃣ National Tiger Corridor Network (NTCN)
Developed by NTCA and WII, connecting 52 tiger reserves across 18 states.
Uses Landsat + SRTM + NDVI + human density to map tiger movement potential.
Identified 32 high-priority corridors , several now targeted for eco-restoration.
2️⃣ Asian Elephant Corridor Project (WII–WWF)
Modeled 101 corridors using LCP + CircuitScape .
Key finding: Over 70% of corridors intersected highways or railway lines.
Resulted in mitigation projects, underpasses, eco-bridges, and reforestation zones.
3️⃣ Central India Landscape Connectivity Model
Combined MODIS NDVI, ALOS DEM, and forest patch metrics for tiger dispersal.
Predicted corridor pinch points with 92% match to camera trap movement data.
Case Example: Kaziranga–Karbi Anglong Corridor
A study in Assam used Sentinel-2, SRTM, and land use maps to model elephant connectivity between Kaziranga NP and Karbi Anglong Hills.
Resistance surface built from forest type, NDVI, slope, and settlement proximity.
LCP analysis revealed three active corridors and two degraded ones .
Circuitscape identified high current flow zones aligning with local elephant paths.
Restoration efforts are now targeting degraded stretches through reforestation and agroforestry incentives.
GeoAI in Connectivity Modeling
Machine learning and AI are improving resistance calibration and validation:
Random Forest / Gradient Boosting: Predict species occurrence and habitat suitability to refine resistance surfaces.
Deep Learning: Identify linear barriers like roads and canals from high-resolution imagery.
Graph Neural Networks (GNNs): Model multi-patch connectivity and detect network vulnerabilities.
Agent-Based Simulations: Animate animal movement under varying land-use and climate scenarios.
GeoAI transforms corridor modeling from static to dynamic, simulating movement as ecological flow that evolves with human change.
Fragmentation Metrics: Quantifying Connectivity Loss
Fragmentation is not just visible, it’s measurable.
Landscape metrics quantify how connected or isolated habitats are:
Metric - Description - Tool
Patch Cohesion Index - Measures physical connectedness of habitat patches - FRAGSTATS
Edge Density (ED) - Proportion of edge habitat to total area - QGIS / ArcGIS Pro
Effective Mesh Size (MESH) - Average size of connected habitat networks - GuidosToolbox
Landscape Connectivity Index (LCI) - Probability of movement between patches - Conefor / Circuitscape
Together, these metrics inform which landscapes are corridor-critical and which are functionally isolated .
Toward Wildlife Corridor Digital Twins
A Corridor Digital Twin can integrate:
Resistance surfaces
LCP and Circuitscape outputs
Real-time animal telemetry (GPS collars)
Land use change forecasts
This twin could simulate:
Dispersal under new infrastructure (highways, solar parks).
Corridor degradation or improvement under restoration scenarios.
Genetic flow connectivity over decades.
Such systems could guide adaptive conservation , where decisions evolve with data.
Outlook: From Connectivity to Coexistence
Connectivity isn’t just about wildlife, it’s about designing landscapes where development and ecology coexist .
Least-cost paths and corridor analytics now inform:
Environmental Impact Assessments (EIAs).
Wildlife crossing design in linear infrastructure.
Land-use planning for green infrastructure networks.
By integrating faunal movement intelligence into spatial planning , we can ensure that the next wave of growth doesn’t erase the natural routes evolution carved over millennia.
Conclusion
Wildlife corridors are not just pathways, they are lifelines of evolution .
Through least-cost path modeling, LiDAR topography, and AI-driven landscape analysis, we can now restore the hidden highways of the wild.
In a fragmented world, connectivity is the new conservation currency.