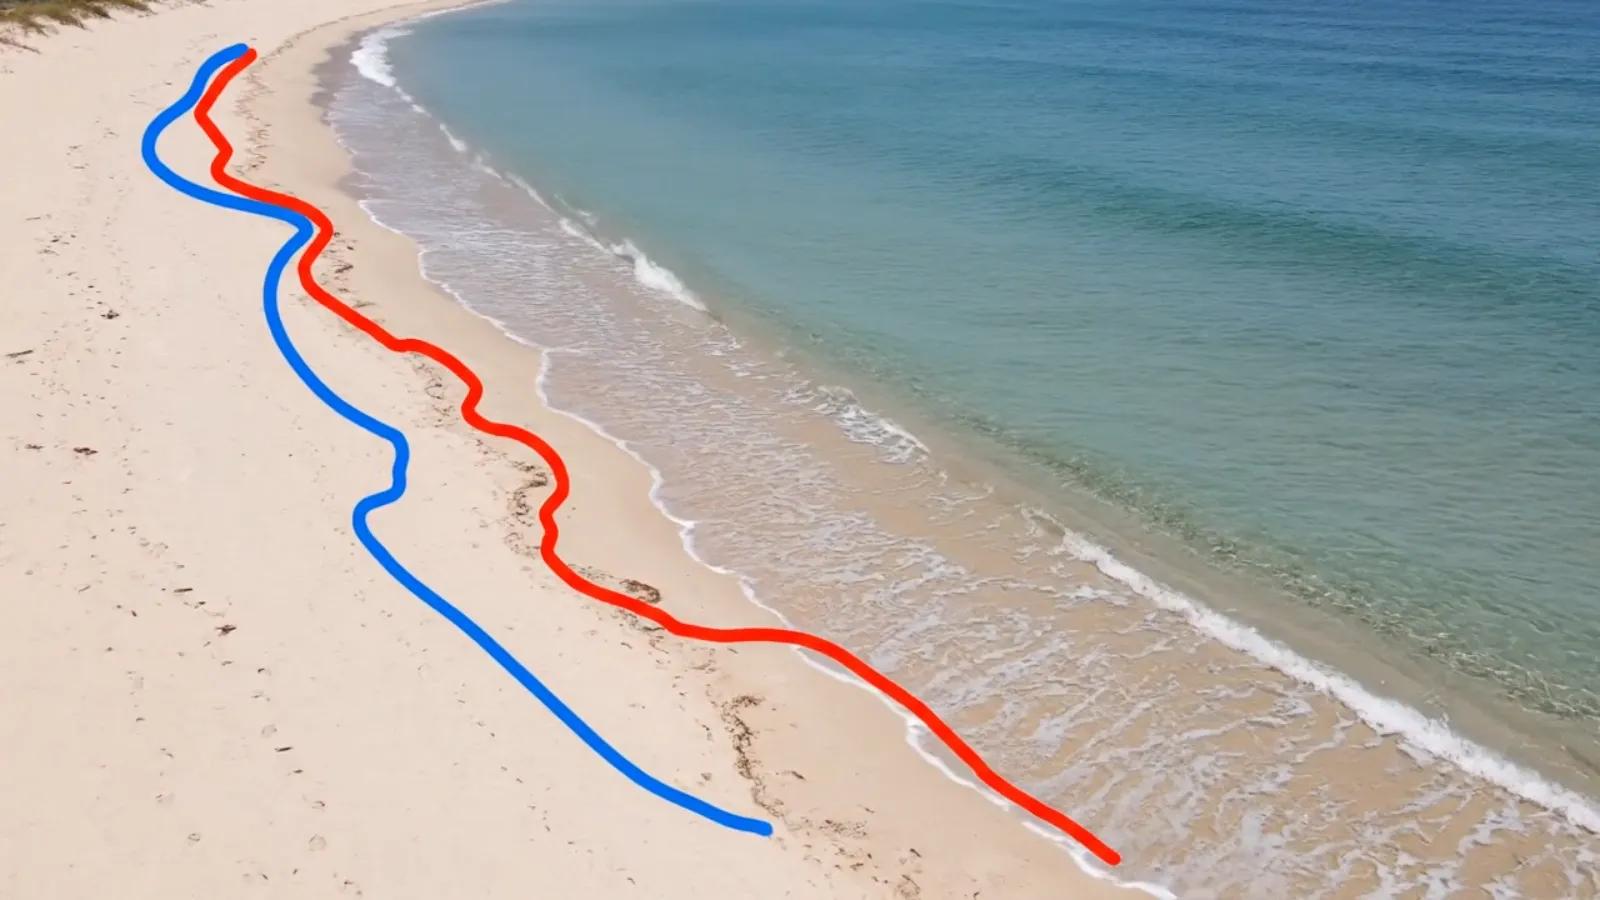
The Living Edge of the Planet
Coastlines are not static boundaries, they are dynamic polylines , redrawn every day by tides, waves, and human activity. The line where land meets sea is the Earth’s most volatile vector, continuously shifting under the influence of natural forces and anthropogenic pressures.
In GIS terms, a coastline isn’t just a polygon edge. It’s a time-aware polyline , constantly updated by data from satellites, tide gauges, and UAVs. Mapping and modeling this “moving boundary” is one of the most active applications of geospatial intelligence, blending physics, data science, and environmental analytics into one integrated layer.
Decoding the Dynamics of Shorelines
Coastlines represent the planet’s interface of change . Every process, erosion, sedimentation, sea-level rise, leaves a spatial signature.
Key drivers behind shoreline dynamics include:
Wave Energy and Tides: Longshore drift and storm surges continuously reshape coastal contours.
Sea-Level Rise: Global rise of 3.4 mm/year (NASA, 2024) causes chronic inundation and beach retreat.
Sediment Transport: River discharge and delta processes alter coastal morphology seasonally.
Human Modifications: Ports, groynes, and seawalls create local distortions in natural sediment flow.
Each of these forces modifies the geometry of the coastline, turning it into a living vector feature that encodes environmental stories over time.
Digitizing the Coast: From Imagery to Polylines
Modern remote sensing and GIS tools allow us to capture and track shoreline changes at unprecedented accuracy:
Optical Satellite Imagery (Landsat, Sentinel-2): Multi-temporal images help detect shoreline shifts using indices like NDWI (Normalized Difference Water Index) and MNDWI (Modified NDWI).
SAR (Synthetic Aperture Radar): Useful for cloud-prone or monsoon-dominated regions; radar backscatter differentiates land-water interfaces.
Drone and UAV Surveys: Provide centimeter-level precision for short stretches—critical for monitoring beaches, ports, and estuaries.
LiDAR and Bathymetry: Capture subaerial and underwater topography for integrated coastal digital twins.
When these datasets are aligned temporally, they reveal how and where the shoreline migrates , transforming the coastline into a measurable time series.
Vectorization and Change Detection Techniques
In geospatial workflows, shoreline extraction converts raster boundaries into vector polylines , which can be compared across epochs:
Edge Detection Algorithms: Sobel, Canny, or NDWI thresholding identify water–land transitions.
Polygon-to-Polyline Conversion: Post-classification results are vectorized for spatial comparison.
Overlay and Distance Analysis: Changes are quantified by measuring the offset between shoreline positions at different dates.
Rate of Change Metrics: EPR (End Point Rate) , distance/time between two shoreline dates. LRR (Linear Regression Rate) , statistical trend from multiple shorelines. NSM (Net Shoreline Movement) , total displacement over a time interval.
GIS tools like DSAS (Digital Shoreline Analysis System) from the USGS automate this process, turning decades of imagery into spatial analytics.
Amplifying Insight: The Indian Context
India’s 7,500 km coastline, spanning 13 states and union territories, experiences some of the world’s most diverse coastal dynamics.
Erosion Hotspots: Nearly 34% of India’s coastline is eroding (NIOT, 2023), especially along Odisha, West Bengal, and Kerala.
Accretion Zones: The deltas of the Mahanadi and Godavari rivers witness sediment-driven expansion.
Urban Stress: Coastal cities like Chennai, Mumbai, and Visakhapatnam show significant shoreline retreat due to construction and reclamation.
Projects such as INCOIS’s Coastal Vulnerability Atlas and Bhuvan’s Coastal Observation System use satellite-based shoreline change mapping to inform disaster preparedness and zoning regulations.
Toward Coastal Digital Twins
Integrating real-time sensing, machine learning, and hydrodynamic models is enabling digital twins of coastlines , virtual simulations of coastal evolution.
AI for Automatic Shoreline Extraction: CNNs trained on multispectral data now achieve >90% accuracy in delineating coastlines automatically.
Hydrodynamic Modelling: Coupled models simulate how tides and waves reshape beaches daily.
Predictive Coastal Twins: Fuse GNSS buoys, tide gauges, and satellite data to forecast future shoreline positions and flood risk.
These digital twins transform reactive monitoring into proactive management, a crucial step for climate adaptation and coastal resilience.
Business and Policy Implications
Understanding shoreline change is not just a scientific task, it’s a strategic one:
Urban Planning: Coastal setback zones and land-use regulation depend on shoreline forecasts.
Infrastructure: Ports, power plants, and pipelines need stable shoreline baselines.
Insurance and Risk Management: Quantified erosion trends inform coastal property valuations and climate risk models.
Ecosystem Management: Mangrove and coral conservation rely on accurate coastal morphodynamics.
By treating coastlines as dynamic spatial assets , organizations can balance economic development with environmental stability.
Outlook: The Moving Line of the Future
Future geospatial models will not only map coastlines but simulate their evolution in near real-time. With hyperspectral satellites, autonomous buoys, and global LiDAR campaigns, we’ll soon have continuously updated polylines describing the planet’s fluid edges.
This living dataset will feed digital twins, enabling cities and nations to plan 10, 20, or 50 years ahead, responding not after erosion happens, but before .
Conclusion
Coastlines are not boundaries, they are signals. Each retreating beach and expanding delta encodes the dialogue between land and sea. By decoding, digitizing, and amplifying this ever-changing line, we move from observation to anticipation, mapping the pulse of the planet’s perimeter.