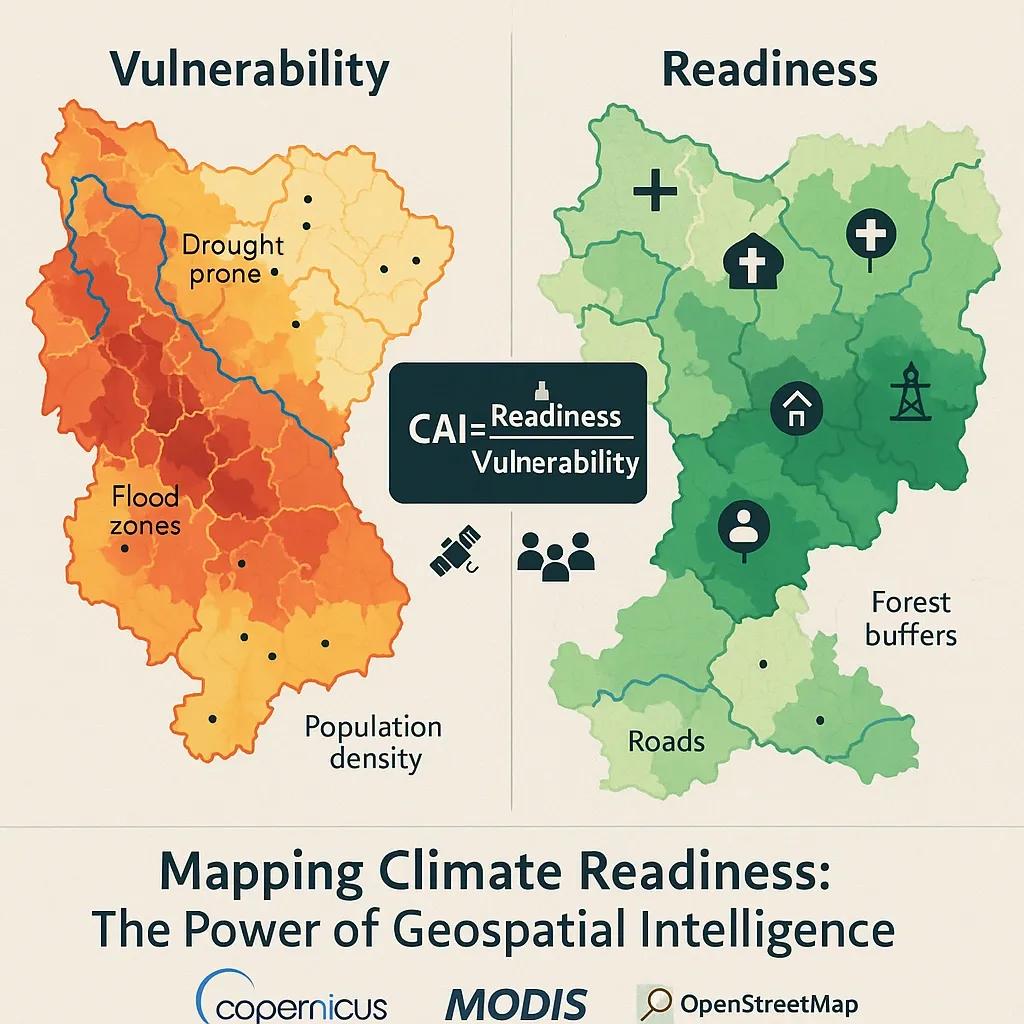
As climate-related risks intensify, ranging from extreme heat and sea-level rise to unpredictable rainfall and resource scarcity, governments and organizations are under pressure to prioritize adaptation measures. While mitigation efforts remain critical, climate adaptation planning is now essential for resilience. A Climate Adaptation Index (CAI) , powered by geospatial data, offers a structured, evidence-based approach to assess and compare the vulnerability and readiness of communities across different regions. This article explores the technical design of such an index, highlighting key components, methodologies, data sources, and implementation strategies.
1. Why a Climate Adaptation Index is Needed
Climate adaptation is inherently spatial. The risks and responses vary by geography, ecosystem, land use, socio-economic status, and infrastructure quality. Traditional indices often lack granularity, producing broad national or state-level scores that miss local risks.
A Geospatially-Enhanced CAI addresses this gap by incorporating remote sensing data, GIS-based models, and Earth Observation (EO) analytics. The goal is to provide a location-specific snapshot of both vulnerability (exposure + sensitivity) and readiness (adaptive capacity), thereby enabling targeted interventions.
2. Framework of the Climate Adaptation Index
The CAI is calculated through a multi-criteria framework that includes two main pillars:
Vulnerability Score (VS)
Readiness Score (RS)
The final index can be represented as:
CAI = RS \ VS
A higher value indicates better preparedness relative to exposure.
3. Geospatial Inputs for Vulnerability Score
The Vulnerability Score measures the degree to which a region is exposed and sensitive to climate risks. Key geospatial data inputs include:
a. Hazard Exposure Layers
Flood risk zones : Derived from hydrological models and historical flood maps.
Drought intensity : Satellite-based Normalized Difference Vegetation Index (NDVI) and Soil Moisture Active Passive (SMAP) data.
Heat zones : Land Surface Temperature (LST) from MODIS or Sentinel-3.
Cyclone and storm surge maps : Based on historical cyclone tracks and elevation models (DEM).
b. Sensitivity Factors
Population density : Census data overlaid on gridded surfaces.
Age demographics : Mapping elderly and children-heavy zones.
Healthcare access : Proximity analysis to clinics and hospitals using road network data.
Land use and housing type : Extracted via satellite imagery classification (e.g., built-up vs. informal housing).
The combined spatial overlay of these layers provides a composite vulnerability map.
4. Geospatial Inputs for Readiness Score
Readiness reflects the capacity of a community to adapt to or recover from climate shocks. It includes infrastructural, institutional, economic, and environmental capabilities.
a. Infrastructure Readiness
Evacuation routes and road connectivity : From OpenStreetMap or local GIS databases.
Shelter availability : Geotagged data on public buildings with capacity information.
Power and water infrastructure : Spatial layers from utility companies or infrastructure databases.
b. Socio-Economic Readiness
Education levels : Mapped via regional literacy and education attainment.
Digital access : Coverage maps for internet and mobile networks.
Livelihood diversity : Agricultural vs. industrial vs. service-based income sources, spatialized using remote sensing and economic survey overlays.
c. Environmental Readiness
Forest and wetland buffers : Mapped using Sentinel-2, Landsat, and LULC datasets.
Soil stability and vegetation cover : Important for erosion and landslide-prone areas.
Each of these geospatial datasets is normalized and aggregated into a single Readiness Score.
5. Data Sources and Tools
To create a reliable and scalable CAI, the following tools and data are typically used:
Component - Data/Tool
Satellite Imagery - Sentinel-1 & 2, Landsat 8, MODIS
EO Datasets - NASA EarthData, Copernicus, NOAA
Administrative Boundaries - GADM, Natural Earth, OpenStreetMap
Spatial Analysis - QGIS, ArcGIS, Google Earth Engine
Machine Learning Models - Random Forests, SVM, Gradient Boosting
Socioeconomic Layers - National Census, UNDP, World Bank
For real-time applications, APIs from platforms like Google Earth Engine and Planet Labs may also be integrated.
6. Index Construction Methodology
Step 1: Indicator Selection
Based on relevance, data availability, and spatial resolution. Expert consultation helps in defining weights for each parameter using methods like Analytic Hierarchy Process (AHP).
Step 2: Normalization
All indicators are normalized to a common scale, typically between 0 and 1.
Step 3: Weight Assignment
Weights can be fixed or dynamically assigned using statistical methods or stakeholder inputs.
Step 4: Composite Scoring
Weighted sum models or Principal Component Analysis (PCA) can be used to combine normalized scores.
Step 5: Validation
Historical disaster response data and ground-truth surveys help validate the CAI outputs.
7. Applications of the Climate Adaptation Index
Urban Planning: Identifying neighborhoods needing climate-resilient infrastructure.
Agriculture: Targeting adaptive interventions like crop insurance or irrigation support.
Health Systems: Strategically placing mobile clinics and supply chains.
Disaster Management: Prioritizing high-risk zones for early warning systems.
Funding Allocation: Directing climate finance or CSR resources based on localized risk scores.
8. Case Study: Coastal Andhra Pradesh, India
Using geospatial CAI modeling, districts like East Godavari and Visakhapatnam were identified as both highly vulnerable (due to cyclone exposure and high population density) and moderately ready (due to good road and shelter infrastructure). This spatial understanding helped local authorities prioritize mangrove restoration in low-lying coastal pockets while upgrading early warning systems inland.
9. Challenges and Considerations
Data Gaps: High-resolution data may be unavailable or inconsistent across regions.
Temporal Relevance: Climate variables and community readiness change over time.
Interoperability: Integration of EO data with local administrative systems requires standardization.
Privacy & Ethics: When using micro-level data, care must be taken to anonymize sensitive information.
10. Future Enhancements
AI Integration: Use of AI/ML for real-time climate risk prediction based on streaming sensor and satellite data.
Crowd-sourced Inputs: Local citizen inputs via mobile platforms can improve accuracy.
Blockchain for Transparency: Immutable records of interventions, resource flow, and outcomes.
Digital Twin Integration: Linking CAI with digital twins of cities or regions for simulation-based planning.
Conclusion
A Climate Adaptation Index with geospatial inputs serves as a practical, data-driven decision-support tool. It transforms scattered environmental and social data into actionable spatial intelligence. For policymakers, planners, and researchers, CAI offers a clear, comparable, and scalable method to guide adaptation strategies, ultimately building resilience at the community level in the face of an uncertain climate future.