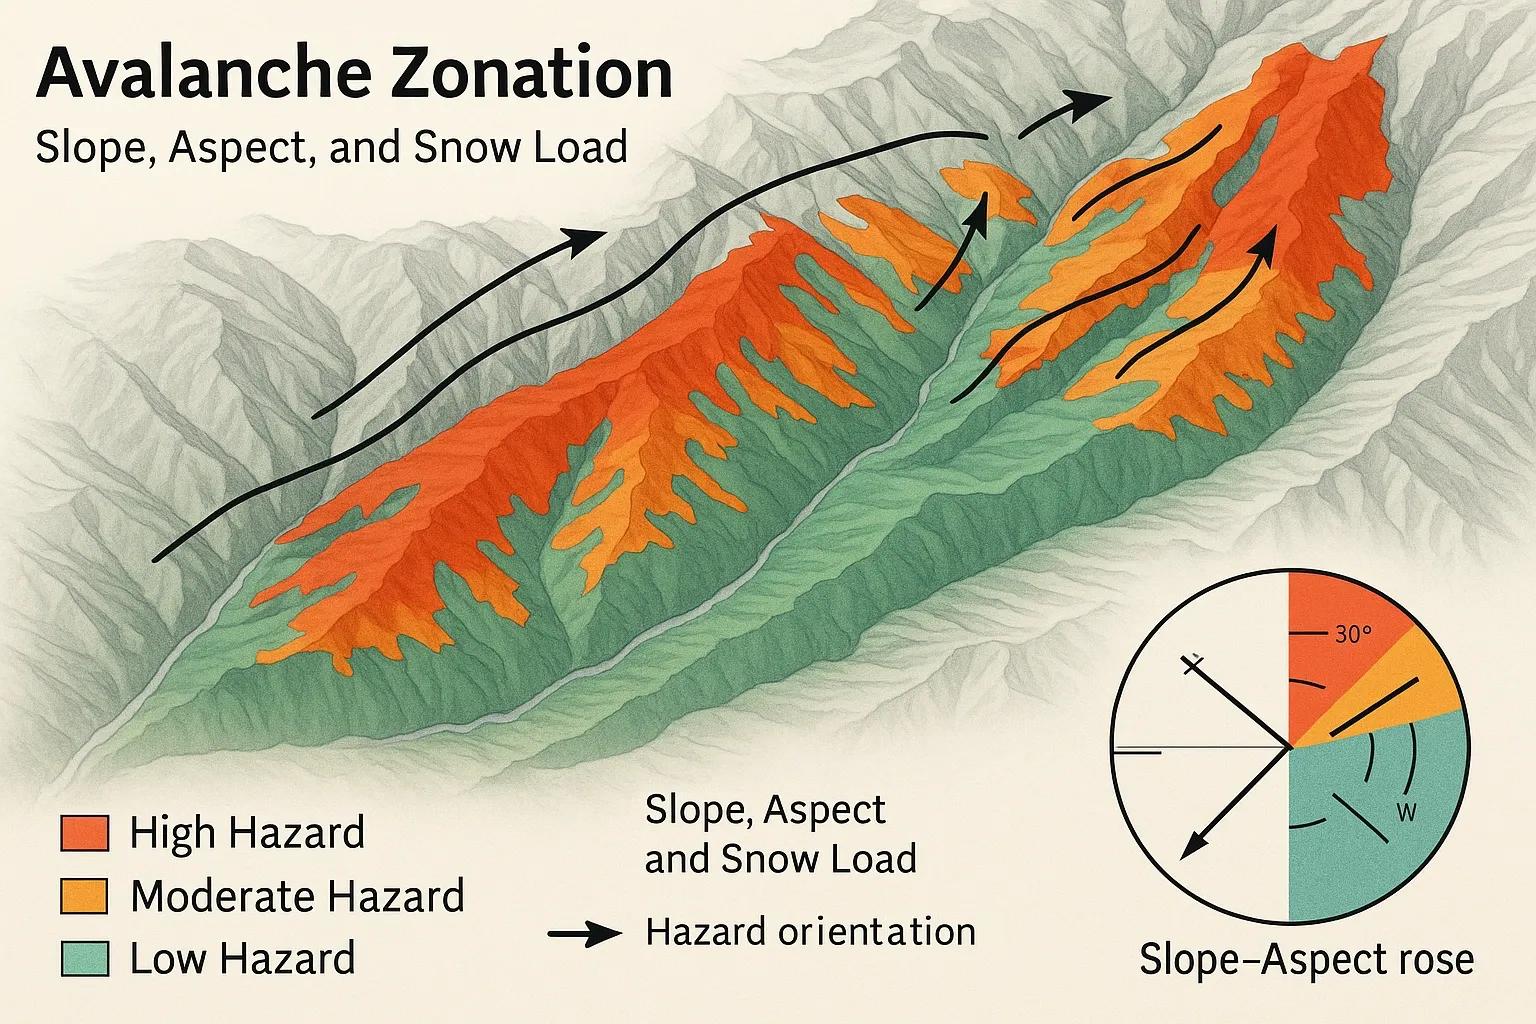
The Slopes That Store Instability
Avalanches are not random winter events, they are spatial outcomes of terrain, snowpack, and weather interacting in predictable ways.
In the Himalaya, avalanche risk is a dominant factor for:
Border roads
Military logistics
Hydropower corridors
Mountain villages
Winter tourism
Geospatial avalanche zonation transforms these risks into mappable layers , helping planners decide what to build, where to build, and how to prepare.
Avalanche Zonation: The Spatial Logic
Avalanche formation depends on three primary terrain controls:
Slope angle
Aspect (sun exposure)
Snow load and accumulation pattern
These layers together identify release zones , track zones , and runout zones , the three stages of any avalanche.
1️⃣ Slope: The First Trigger Zone
Most slab avalanches occur within a narrow slope band:
28° to 45° → highest release probability
<25° → generally stable
>50° → snow sluffs rather than forming slabs
Using DEMs (SRTM, ALOS 30 m, Planet stereo DEM, CartoDEM 10 m), slope rasters are used to highlight:
Ridge-top start zones
Convex rollovers
Over-steepened terrain units
In avalanche science, slope >30° is effectively the “red zone.”
2️⃣ Aspect: The Thermal Driver
Aspect controls snow temperature, melt–freeze cycles, and bonding strength .
In the Himalaya:
North-facing slopes → persistently cold → weak layers, buried facets
South-facing slopes → solar radiation → wet-slab avalanches in spring
East-facing slopes → early-day warming → morning instability
West-facing slopes → late-afternoon warming patterns
Aspect layers therefore help classify time-of-day and season-of-year avalanche susceptibility.
3️⃣ Snow Load & Accumulation: The Mass That Must Slide
Snow load (water equivalent × depth) is a strong predictor. Inputs:
SWE (Snow Water Equivalent) from AMSR2, ERA5-Land
Snow depth from Sentinel-1 SAR backscatter, ICESat-2 tracks
Wind redistribution models that show cornice formation
Heavy snowfall events from IMD / IMERG
Danger spikes when:
New snow > 25–30 cm in 24 hours
Rain-on-snow events occur
Wind slabs form leeward pillows
Temperature rises >0°C after heavy snowfall
Snow load maps identify slabs primed for release .
Combined Avalanche Susceptibility Mapping (ASM)
A typical ASM is built using a weighted overlay:
Risk = w_1 (Slope) + w_2 (Aspect) + w_3 (Snow Load) + w_4 (Land Cover) + w_5 (Elevation)
Where weights come from field data, past events, or machine learning calibration.
Output zones:
High Hazard (HHZ) , steep, cold, leeward slopes with deep slabs
Moderate Hazard (MHZ) , transitional zones, potential tracks
Low Hazard (LHZ) , gentle slopes and valley floors
Runout Zones , modeled using 𝛼-angles and flow models (RAMMS)
These maps guide road realignments, snow galleries, and winter patrol planning.
India’s Avalanche Mapping Framework
India has one of the world’s most advanced mountain hazard monitoring systems via SASE (DRDO) .
They integrate:
MODIS snow maps
ERA5-Land snowfall & temperature
Sentinel-1 snow wetness indices
SRTM-based slope roughness
Field stations for snowpack profiles
Outputs feed into:
Avalanche advisories for border roads
Zonation maps for BRO, Army, and HEP projects
Forecasting dashboards in high-risk sectors
Case Example: Pir Panjal & Lahaul–Spiti Corridor
Using DEM + SAR + ERA5 snowfall:
High-risk slopes identified between 3,000–3,800 m
Leeward sides of ridgelines showed deep wind slab formation
Runout modelling showed potential impacts on 2 BRO road segments
These insights informed gallery construction , snowpack monitoring , and safe-time windows for logistics movement.
GeoAI for Avalanche Prediction
AI improves avalanche zonation by learning from historical failures:
Random Forest / Gradient Boosting: Combine terrain + weather + snow parameters
LSTM: Time-series snow stability forecasting
CNN: Automatically map avalanche debris from high-res imagery
SAR coherence ML: Detect weak layers and wet snow signatures
These models convert raw snow physics into operational mountain intelligence .
Toward an Avalanche Digital Twin
A regional avalanche twin would integrate:
DEM-derived slope/aspect
SWE and temperature fields
Wind redistribution models
Real-time SAR wet-snow classification
Snowpack stability indices (SSI)
RAMMS or DAN3D runout simulations
This twin can simulate:
New snow loading scenarios
Spring warming cycles
Wet slab triggers
Infrastructure exposure
Safe corridor planning
Perfect for BRO, Army, and HEP planning in the Western & Central Himalaya.
Conclusion
Avalanche risk is not random, it is spatial logic.
When slope, aspect, and snow load align, instability is inevitable.
With high-resolution DEMs, SAR-derived wet snow maps, and AI-driven stability models, avalanche zonation is becoming a predictive, data-driven discipline , essential for building and operating safely in the Himalaya.