Roads don’t fail overnight. They decay through traffic, water ingress, temperature swings, and poor drainage. AI models can learn those decay patterns; GIS gives them spatial context and scale. Together, AI + GIS turns raw field inputs (images, sensors, inspections) into actionable, map-based maintenance plans, before failure, not after.
Why roads fail (and why reactive repairs cost more)
Load & usage: Heavy AADT and axle mixes accelerate cracking and rutting.
Water & drainage: Standing water drives stripping and base failures.
Materials & age: Binder aging and subgrade type shift trajectories.
Climate variability: Temperature cycles expand microcracks.
Work history: Patchwork gaps become weak points.
The problem isn’t data scarcity, it’s signal extraction at network scale and prioritization across thousands of segments under budget constraints.
What AI + GIS changes
1) Multimodal data fusion
Vision: Smartphone fleets, dashcams, drones, object detection for cracks, potholes, rutting.
IoT & telemetry: Vibration, accelerometer spikes, and roughness proxies.
Geospatial layers: AADT, axle load corridors, DEM slope, drainage networks, rainfall intensity, land cover (e.g., NDVI), material/age, utility cuts.
Inspection & PMS: PCI, IRI, maintenance history.
2) Predictive models
Targets: Probability of pothole formation, PCI at T+3/6/12 months, expected treatment class.
Approaches: Gradient boosting, temporal survival models, spatiotemporal GNNs for network effects, Bayesian updating as new evidence arrives.
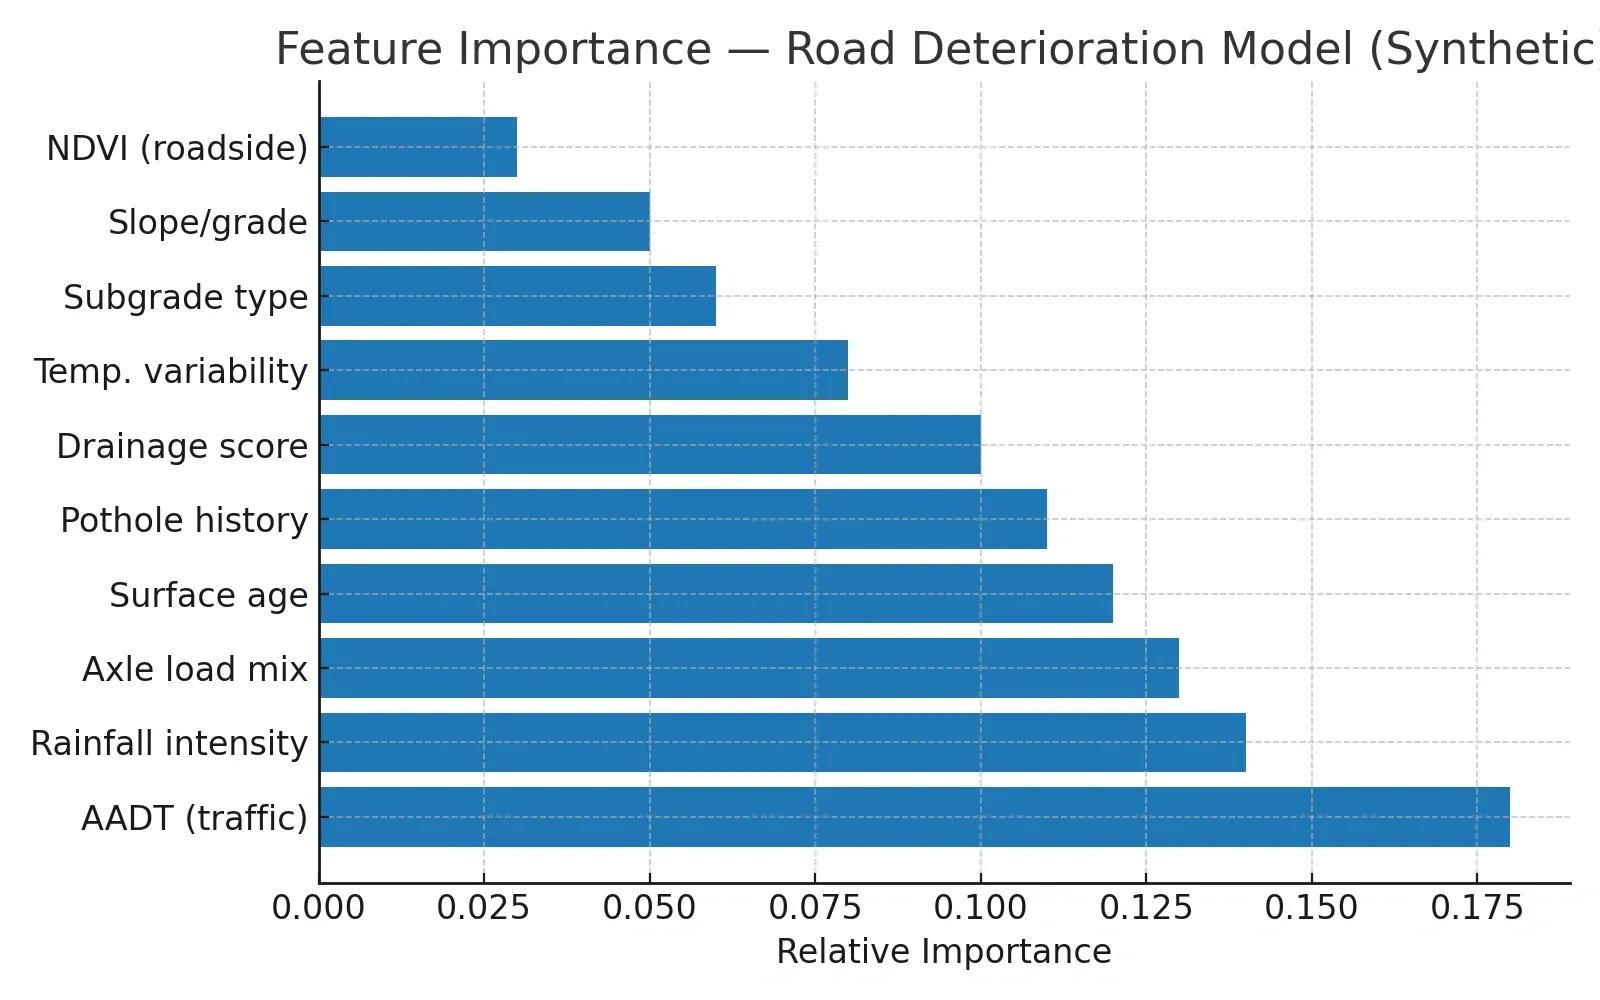
Explainability: Feature attribution clarifies why a segment is risky (drainage score, AADT, subgrade type), helping engineers audit decisions.
3) GIS-first delivery
Risk tiles & segment scoring: Every road link gets a failure risk and time-to-threshold.
Programmatic bundling: Group nearby segments into work packages to reduce mobilization cost.
What-if planning: Simulate budget scenarios and see PCI lift on the map.
Would you trust AI to auto-generate your monthly patch list if you can see the top three drivers per segment?
PCI deterioration, three sample segments
This shows how different usage profiles cross the maintenance trigger at different times.
Minimal operating model (MOM) for a city/PWD/NHAI division
Data pipeline Weekly imagery (vehicle-mounted/driver app) + periodic UAV for hotspots. IoT from buses/garbage trucks for vibration roughness proxies. GIS base layers: traffic, rainfall, slopes, drains, material/age, utility trenches.
Model training loop Label historic failures from CMMS/PMS. Train baseline gradient-boosted model; validate on holdout corridors. Calibrate thresholds to your maintenance trigger (e.g., PCI ≤ 60).
Decision layer Map risk, generate next-6-weeks micro-scope (patches) and next-6-months program (resurfacing). Export to work orders, track outcomes, retrain monthly.
Feature importance, road deterioration model (synthetic)
Helps stakeholders see why the model flags a link as risky.
Use case: Monsoon-prone urban corridor (India)
Context: A 42-km arterial sees mixed traffic, frequent utility cuts, and seasonal waterlogging.
Setup: Riders’ smartphones and municipal vehicles collect imagery biweekly. GIS layers include rainfall intensity, drainage lines, DEM slope, and AADT from count stations.
Model outcome: Predicts pothole probability >0.6 on 11% of links within 90 days, clustered near poor drains and high AADT junctions. Recommends micro-surfacing and patchwork bundles in three wards.
Result: Planned patching reduces emergency jobs by ~30–40% in monsoon months; resurfacing is shifted forward selectively for links forecast to cross PCI 60 within the next quarter.
Why it worked: The city used explainable drivers (drainage score, AADT, pothole history) to defend the plan to finance and public works committees.
Implementation notes (what matters in practice)
Coverage beats perfection: Medium-quality images at high frequency > ultra-HD once a year.
Balance: precision vs recall: Missing a future pothole is costlier than an extra preventive patch. Tune thresholds accordingly.
Human-in-the-loop: Engineers validate the top N risky links weekly; that feedback is gold for retraining.
Standardization: Keep segment IDs stable; normalize IRI/PCI collection intervals.
Governance: Store imagery and labels with audit trails; document feature engineering.
Interoperability: Export to PMS/CMMS and procurement formats; don’t strand insights in a map viewer.
Benefits & ROI (typical patterns)
20–40% fewer emergency pothole tickets during peak season.
10–25% savings by shifting from reactive to planned bundles.
Faster approvals with transparent, explainable scores.
Longer pavement life by intervening before structural layers fail.
Citizen trust via visible, proactive maintenance.
Conclusion
AI learns decay patterns; GIS grounds them in space, context, and operations. The win isn’t a “smart” map, its fewer surprises, better bundles, and evidence-backed timing. Start small: one corridor, 12 weeks, a simple model, weekly validation. Scale once the loop is stable. That’s how you get from demo to dependable.