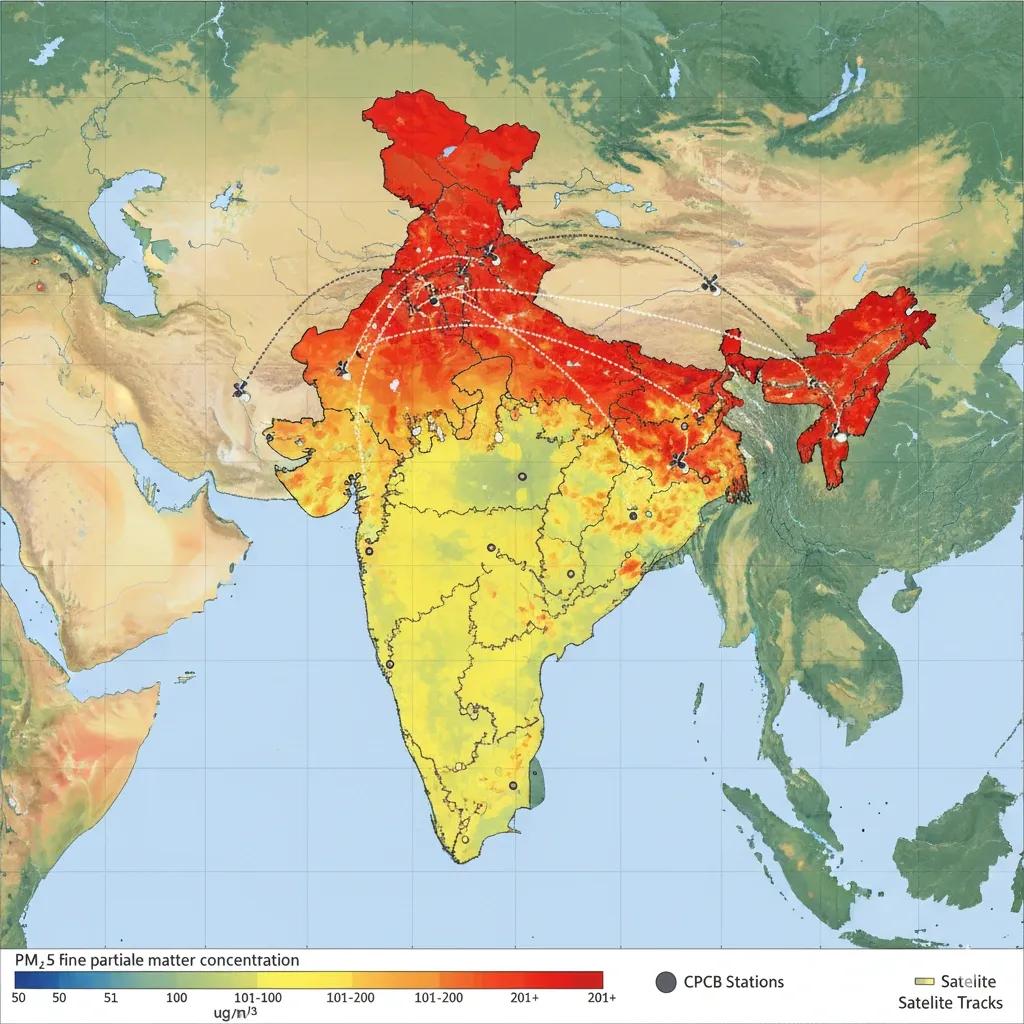
The Air Has a Topography Too
Not all maps are about land or water, some chart what we breathe.
Aerosols and particulate matter (PM₂.₅ and PM₁₀) form the invisible terrain of the atmosphere , reshaping health, visibility, and even rainfall.
Today, satellite remote sensing + ground network sensor fusion has turned air quality into a measurable, mappable dataset.
From NASA’s MODIS and Sentinel-5P to India’s CPCB and SAFAR stations, we’re building a geospatial layer of living air , one that updates every few hours and tells us how the sky above us is changing.
Decoding Aerosols: What Satellites See vs. What We Breathe
Aerosols are tiny solid or liquid particles suspended in air, dust, smoke, sulfates, black carbon, sea salt.
Their optical properties affect how sunlight scatters and how the Earth cools or warms.
Satellites capture them as Aerosol Optical Depth (AOD) , a measure of how much light is blocked by aerosols in a column of air.
Ground stations, however, measure PM₂.₅ and PM₁₀ , particulate concentrations in micrograms per cubic meter (µg/m³).
The fusion of these two datasets, columnar and surface, bridges the gap between what satellites see from space and what humans feel on the ground.
The Fusion Model: Turning AOD into PM₂.₅
The process of converting AOD into near-surface PM₂.₅ involves several geospatial and atmospheric variables:
1️⃣ Data Sources:
Satellite: MODIS, MISR, Sentinel-5P (TROPOMI), MAIAC AOD products.
Ground: CPCB & SAFAR monitoring networks, low-cost IoT sensors.
Meteorology: Temperature, humidity, boundary layer height (from ERA5 or MERRA-2).
2️⃣ Regression & Machine Learning Models:
Multi-linear regression (AOD × RH × PBL height).
Random Forest / XGBoost / LSTM models trained with collocated ground data.
Output: hourly or daily PM₂.₅ surface concentration maps at 1–5 km resolution.
3️⃣ Validation:
Statistical comparison with CPCB station observations.
Typical correlation (R²) for India: 0.7–0.9 , depending on season and region.
This fusion produces continuous, high-resolution AQI maps , filling gaps where ground stations are sparse.
India’s Air Intelligence Network
India operates one of the world’s fastest-growing air monitoring systems, yet spatial gaps remain.
Here’s how national programs are bridging them:
CPCB & State PCBs: 500+ continuous ambient air quality monitoring stations (CAAQMS).
SAFAR (System of Air Quality Forecasting and Research): High-resolution forecasts for Delhi, Pune, Mumbai, Ahmedabad.
ISRO’s MAIAC-AOD Data + IITM Models: Used for regional PM₂.₅ estimation.
National Clean Air Programme (NCAP): Targets 102 cities for 20–30% PM₂.₅ reduction by 2026.
In 2023, CPCB and NRSC jointly launched a pilot satellite–ground fusion platform for north India, integrating MODIS AOD, Sentinel-5P NO₂, and CPCB PM₂.₅ data.
It provided daily AQI maps at 1 km scale, now being extended pan-India.
AQI: Translating Data to Public Meaning
The Air Quality Index (AQI) converts raw PM₂.₅/PM₁₀, NO₂, SO₂, CO, and O₃ values into a single, intuitive score (0–500).
AQI Range - Category - Health Impact
0–50 - Good - Minimal
51–100 - Satisfactory - Acceptable
101–200 - Moderate - Sensitive groups affected
201–300 - Poor - Breathing discomfort
301–400 - Very Poor - Respiratory illness likely
401–500 - Severe - Health emergency
Using fused PM₂.₅ surfaces, AQI maps can now be generated city-wide or region-wide , offering real-time insights into pollution exposure patterns.
Case Example: Delhi–NCR Air Quality Fusion
During the winter of 2023, researchers from IIT-Delhi and NRSC integrated Sentinel-5P AOD , CPCB PM₂.₅ data , and ERA5 meteorological layers to generate fused AQI maps at 1 km resolution .
Findings:
PM₂.₅ levels peaked at 260–300 µg/m³ in industrial belts.
Fused models improved spatial accuracy by 25–30% over satellite-only methods.
Correlation with CPCB stations: R² = 0.88 , RMSE = 15 µg/m³.
This approach enabled local-scale policy insights , such as identifying pollution transport corridors from Haryana into Delhi’s northwest zones.
GeoAI in Air Quality Modeling
Artificial Intelligence now enhances aerosol mapping and forecasting:
LSTM Models: Predict short-term PM₂.₅ variation using reanalysis + meteorology.
CNN Models: Extract pollution patterns directly from AOD imagery.
Spatio-Temporal Fusion Networks: Merge multiple satellite sources to fill data gaps during cloud cover.
Digital Twins: Integrate IoT sensors, traffic data, and emissions inventories for hyper-local AQI prediction.
GeoAI is transforming AQI from a static number into a dynamic feedback system , capable of learning and adapting as new data arrives.
From Monitoring to Management
Mapping pollution is only half the story. The next step is data-driven intervention:
Urban Planning: Identify ventilation corridors to improve air flow.
Industrial Regulation: Link factory emissions to downwind AQI impact.
Public Health: Correlate exposure zones with hospital admission data.
Citizen Engagement: Share open AQI maps via apps and dashboards.
These fused datasets power India’s transition from reactive alerts to proactive environmental management.
Outlook: India’s Air Quality Digital Twin
A national-scale Air Quality Digital Twin could integrate:
Near-real-time satellite + ground fusion maps.
Predictive analytics using machine learning.
Emission inventories + weather forecasts.
Automated alerts for high-risk zones.
Such a twin would provide a 360° atmospheric intelligence system , bridging science, governance, and public awareness.
Conclusion
The air we breathe is now a mappable dataset, one that evolves hourly, visible in colors, gradients, and vectors.
By fusing satellite and ground data, we’re transforming invisible threats into quantifiable insights , bringing precision to pollution policy and accountability to air management.
The challenge ahead isn’t about measuring more, it’s about acting faster.